Combinatoric Data Generator Tool
The Combinatoric Data Generator produces a CSV file which contains the coverage results data for every possible combination of enabled or disabled detectors.
Accessed via the Project Menu, the Combinatoric Output Window (shown below) allows users to select the zone to consider, and whether risk grades and/or sub-zones are included in the output.
By default the All checkbox is selected which will cycle through all the detectors listed in the window. Disabled devices will not appear here. Alternatively, you may uncheck the All checkbox and select a sub-set of devices by Ctrl+Clicking each, which may be useful in a project where you have one fire zone a long way from another, and you only want the detectors close to the one fire zone to be included.
Before exporting, select the number of combinations to consider. By default, 2 is selected, which means the following scenarios are considered: no detectors disabled, combinations of one detector disabled, and combinations of two detectors disabled. Clicking “Export” will generate a CSV file to view the results.

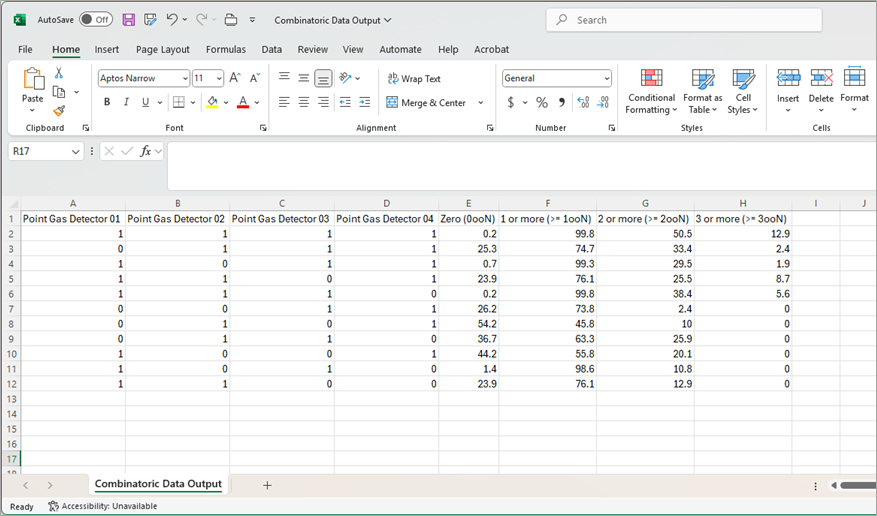
A sample output from the Combinatoric Data Generator is shown below. The first four columns of the excel represent the detectors in the project (as there are only four detectors), the remaining columns provide the coverage results for the various combinations of detectors enabled or disabled. In the cells of these first columns, a value of 1 means the detector is enabled and a value of 0 means the detector is disabled. The corresponding coverage results for the 11 scenarios are given on each row for 0ooN, 1ooN, 2ooN, and 3ooN.
Other options in the Combinatoric Output are for including the Risk Grade Data and including the Sub-Zone data:
-
including risk grade data will provide additional columns corresponding to the 0ooN, 1ooN, 2ooN and 3ooN results for all risk grades in the project
-
including sub-zones will provide additional columns corresponding to the 0ooN, 1ooN, 2ooN and 3ooN results for each sub-zone associated with the zone selected for output
Note: if a control voting logic is applied to a risk grade and that risk grade is assigned to the zone and sub-zone being used for the combinatoric data generator output, then the voting logic will be reflected in the combinatoric output.