Detector Contributions
The British Standard 60080:2020 for fire and gas mapping recommends that devices should be looked at on an individual basis when optimizing layouts in order to determine when "diminishing returns" occur for detector coverage - where adding more detectors is not cost efficient in terms of coverage or price of the installation and maintenance.
As of version 2.54, Detect3D allows for users to view a graph and table of the coverage contribution for each detector in the project. This assessment can be performed for zones or sub-zones in the project and for flame or gas detectors.
To open the Detector Contributions:
-
If you are starting from the last section, enable all detectors in the project, by right-clicking each and selecting
 .
. -
Click the Detector Contributions icon on the toolbar (
 ), or select the same from the Project Menu, and choose Fire Zone: Main Zone from the available options.
 -
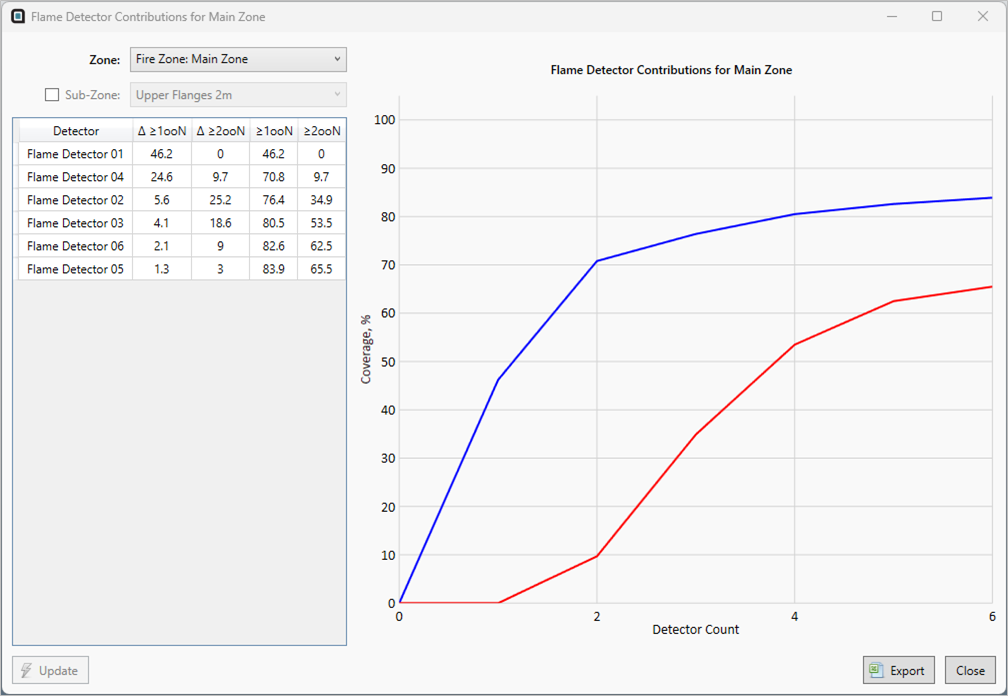
A quick calculation will occur and the following chart will appear.

Tutorial 11 - Figure 16 - Detector Rankings for the Main Zone of the Tutorial 11 project
The 1ooN (blue) and 2ooN (red) coverages are shown in a chart with y-axis representing the achieved coverage value for each detector on the x-axis.
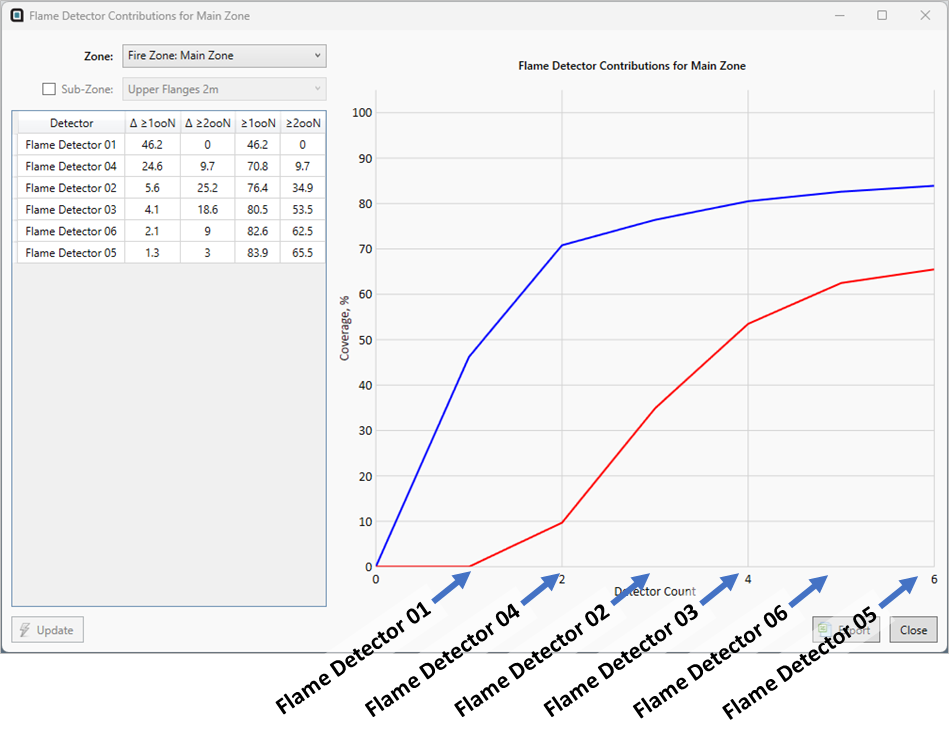
The listing of the detectors in order of importance is shown to the left of the chart. The order of this list directly relates to the order on the x-axis of the chart, meaning Flame Detector 01 contributes 46.2% 1ooN coverage by itself - the detector count "1" on the x-axis, shown below. Further, Flame Detector 04 relates to the detector count "2" value on the x-axis together with Flame Detector 01 achieving 70.8% 1ooN coverage.

Tutorial 11 - Figure 17 - Showing the order of the listing of the detectors indicates their order on the x-axis.
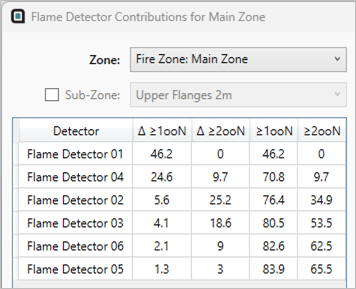
The list of devices has four columns, seen in Figure 18. The first two columns represent the additional increment in 1ooN and 2ooN coverages for each row of detectors. The last two rows show the sum of 1ooN and 2ooN coverages for that row plus each prior row, meaning Flame Detector 02's combined 1ooN coverage (76.5%) is the sum of 1ooN coverage from Flame Detector 01 (46.3%), Flame Detector 04 (24.6%) and Flame Detector 02 (5.6%).

Tutorial 11 - Figure 18 - Ordered list for the Detector Contributions
From Figure 18 and Figure 17, we see that only an additional 3.4% 1ooN coverage is achieved after the 4th detector in the list (Flame Detector 03). This information can be used in combination with the rankings tool to determine if Flame Detector 06 and Flame Detector 05 are needed for the layout. Generally, the benefit of additional detectors lessens as the 1ooN and 2ooN curves flatten out.
Detector Contributions for Sub-Zones
Switch the Detector Contributions chart to look at the Upper Flanges 2m sub-zone:
-
Click the checkbox next to Sub-Zone in the Detector Contributions window.
-
Select Upper Flanges 2m from the dropdown menu
-
Click the Update button on the bottom left of the contributions window

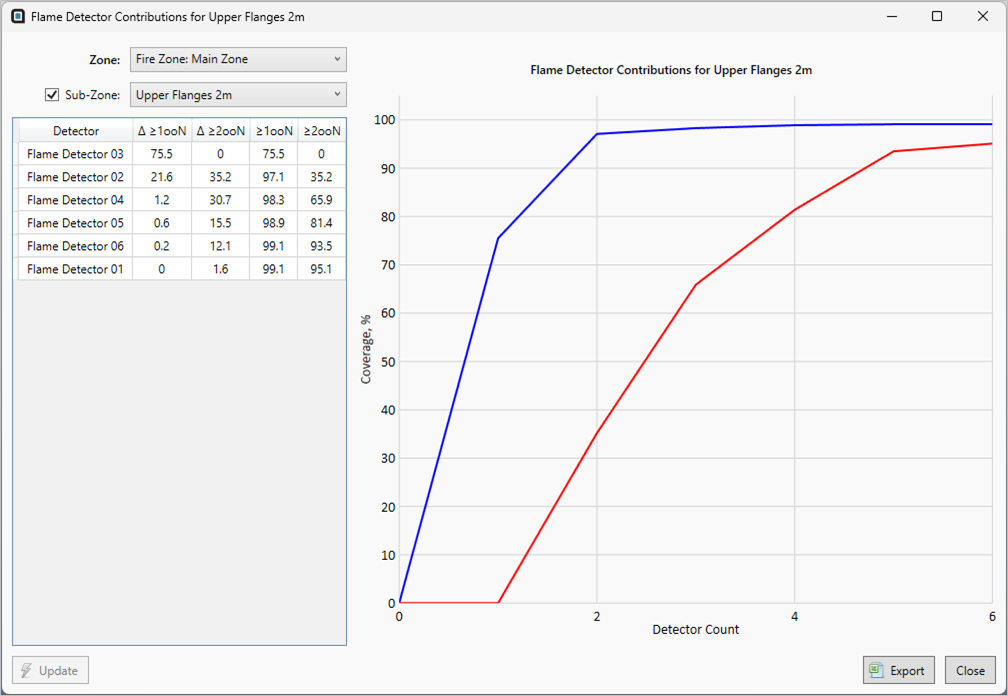
Tutorial 11 - Figure 19 - Detector Contributions for Sub-Zones
Here in Figure 19, we see that devices ordered after detector 2 (Flame Detector 02) only provide an additional 2% 1ooN combined coverage. With Flame Detector 01 not contributing at all towards the 1ooN coverage results for the sub-zone.
Utilizing the Detector Rankings Tool with the Detector Contributions Tool helps show which detector are most and least important to the analysis as well as determining when there's no additional benefit for the addition of devices.
You have now completed Tutorial 11 and should understand how to disable detectors as well as how to use the Detector Rankings Tool and Detector Contributions Tool.
When you have finished viewing the results close the project.