Initial Layout Assessment
Commonly mapping projects are performed on existing facilities which already have detectors in place. Clients typically only provide the CAD models and current positions of devices. This tutorial will simulate such a project.
The client had a mapping assessment completed and needs an additional assessment of the layout. The previous mapping assessment on the Main Zone resulted in six flame detectors. However, after further review it was determined that the set of flanges above the large vessel as well as the valves in the lower section of the pipework were areas with high risk. Thus, the client wanted sub-zones to encompass each of these two regions (shown in Figure 2) and specified a performance target of 90% 1ooN coverage and 70% 2ooN coverage for each. No target was set for the Main Zone.
The goal is now to optimize the layout to minimize the number of devices used while achieving the above coverage targets.
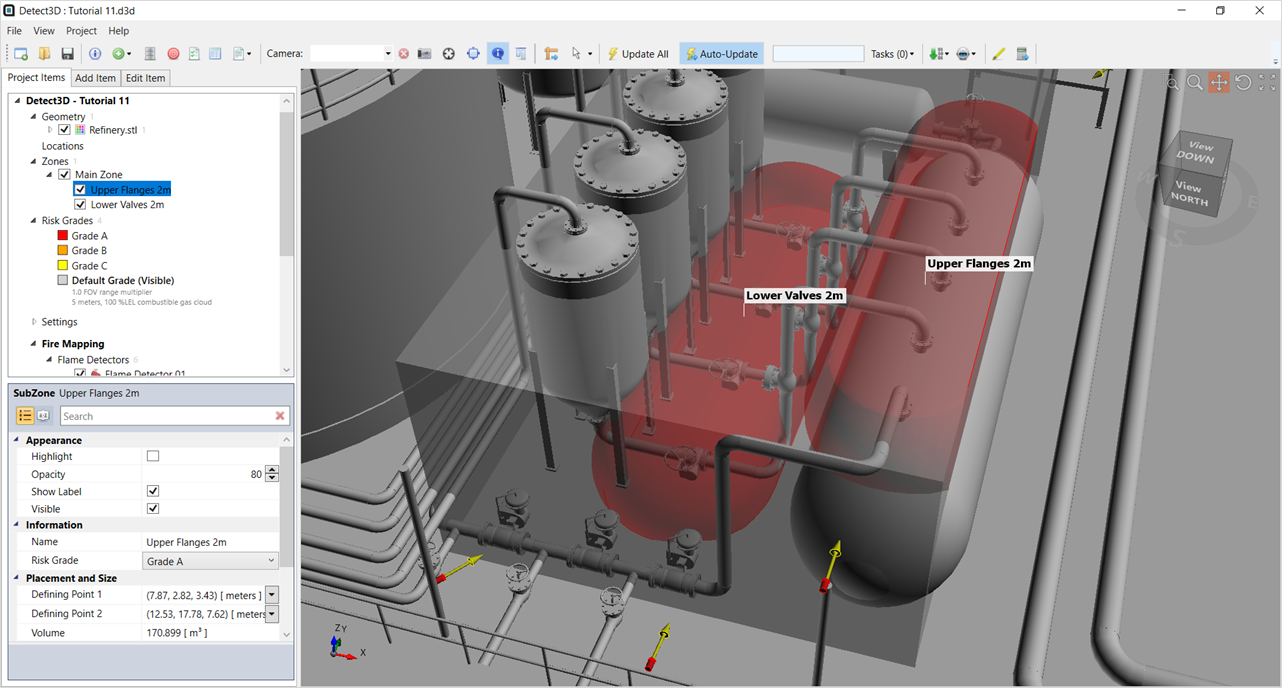
Tutorial 11 - Figure 02 - Location of sub-zone regions suggested to be used by the client
Take a look at the current detector layout by turning on the visibility of the z = 6 m Contour, seen in Figure 3. This indicates a large region of redundant coverage (yellow and green on the contour), having more than the necessary coverage amount.
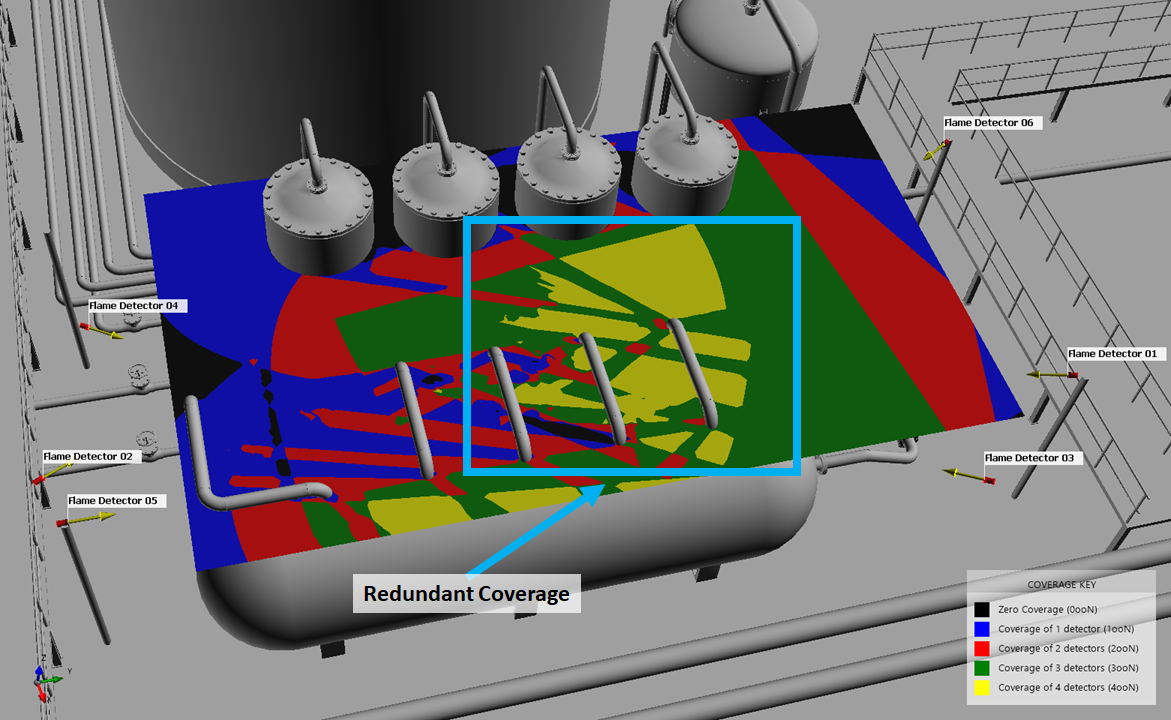
Tutorial 11 - Figure 03 - Indication of region with 4ooN coverage
In this example, the client has requirements for only 1ooN and 2ooN coverage. By looking at the contour in Figure 3 and contours at other heights, it can be determined that the layout can be optimized - coverage of 3 and 4 detectors in one area alludes that optimization and using the rankings tool can lower the detector count.
This can be done by either removing or re-positioning devices. The Detector Rankings Tool helps determine which detectors are least effective in the total layout, facilitating this process.
Before continuing, make note of the current coverage achieved by the six detectors for both sub-zone regions:
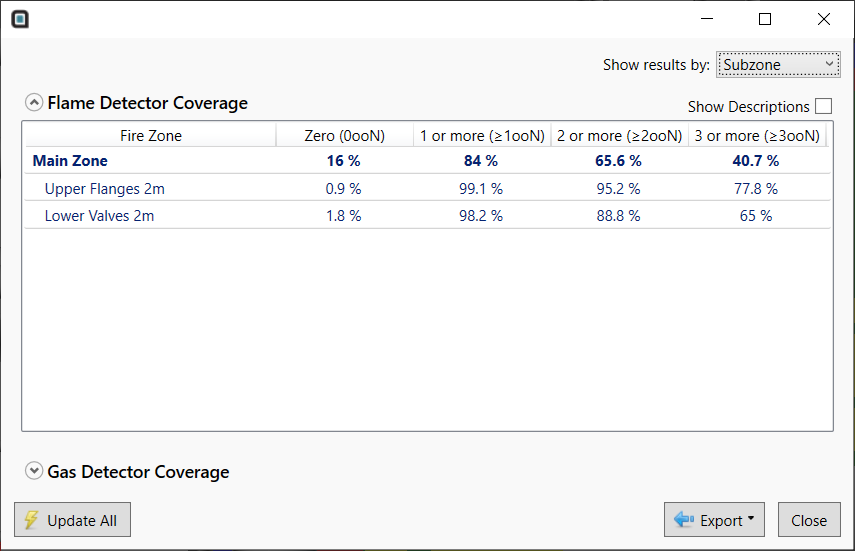
Tutorial 11 - Figure 04 - Coverage obtained by original layout from the Client
The client requires 90% 1ooN and 70% 2ooN in each of the sub-zones. In the next section we will use the 0ooN isovolume and the Detector Rankings Tool to discern how to minimize the number of detectors while maintaining the performance target.