Detector Rankings Tool
One of the more advanced capabilities of Detect3D is the Detector Rankings Tool. The tool quickly disables then enables each detector in the project. When the device is disabled the change in coverage results for 1ooN and 2ooN are recorded before continuing to the next device. This process usually takes under 10 seconds depending on the size of the project. Once complete, the rankings tool then lists or ranks each detector in order based on a weighted average of the 1ooN and 2ooN changes in coverage. The higher the deficit the more important that device is to the total analysis. The opposite is then also true, allowing users to remove or re-position the worse performing detectors - which will be done in this example.
To open the detector ranking tool:
-
Click the
 Detector Ranking button on the tool bar or select Detector Rankings from the Project Menu. Choose Fire Zone: Main Zone from the available options.
 -
After a short calculation the window shown below appears with a table labeling a Best and Worst detector.
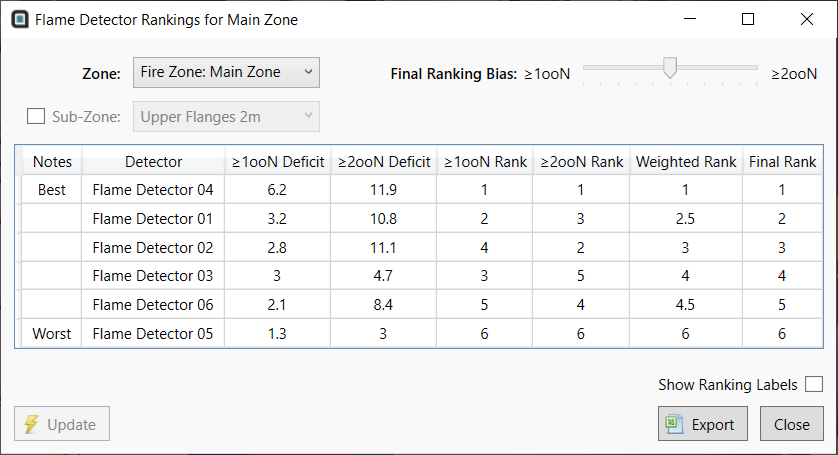
Tutorial 11 - Figure 05 - Detector Rankings Window
-
The first column shows the 1ooN Deficit, representing how much the 1ooN coverage lowered when each detector was disabled. Similarly, the second column shows the 2ooN deficit. The rank of each is listed in the 3rd and 4th columns of numbers, respectively. The 5th column displays the Weighted Rank of the analysis. This weighting is initially set as an average between the 1ooN and 2ooN ranks (average of the 3rd and 4th columns). You can change this by sliding the Final Ranking Bias bar in the upper right side of the window, seen in Figure 6
-
Slide the Final Ranking Bias bar all the way to the right, this will set the Weighted Rank to solely look at the 2ooN rank and ignore the 1ooN rank. Notice how Flame Detector 03 and Flame Detector 06 have changed positions in their ordering in the table, the same has happened with Flame Detector 01 and Flame Detector 02. The order of the rows in the table is based fully on the second column (2ooN Deficit) of results, as indicated below.
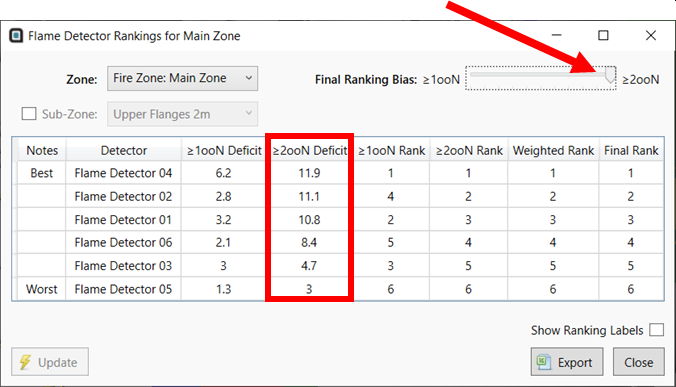
Tutorial 11 - Figure 06 - Rankings window displaying results with a bias for the 2ooN rank of the detectors
-
Now slide the Final Ranking Bias bar all the way to the left, setting the bias to now be only based on the 1ooN rank. Here Flame Detector 01 is now ranked 2nd best and Flame Detector 06 is ranked 2nd worst. The order of the rows in the table is based fully on the first column (1ooN Deficit) of results, ignoring the 2ooN deficit.
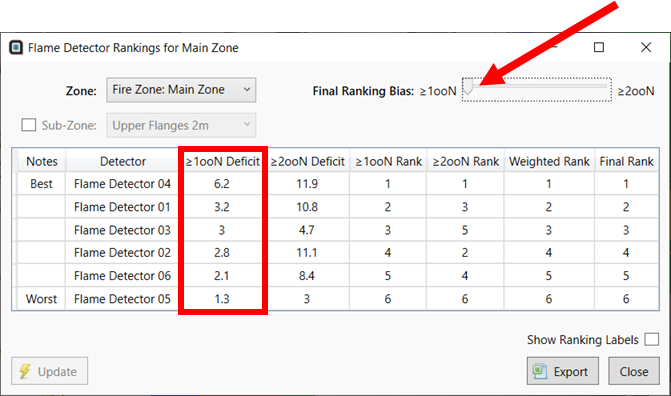
Tutorial 11 - Figure 07 - Rankings window displaying results based only on the 1ooN rank of the detectors
-
Move the slider back to the middle, giving an even bias to 1ooN and 2ooN rankings as Figure 5 above.
-
Click the checkbox for Show Ranking Labels at the bottom right of the window. This will toggle the visibility of an additional label in the 3D window for each detector indicating its rank as shown in the image below.
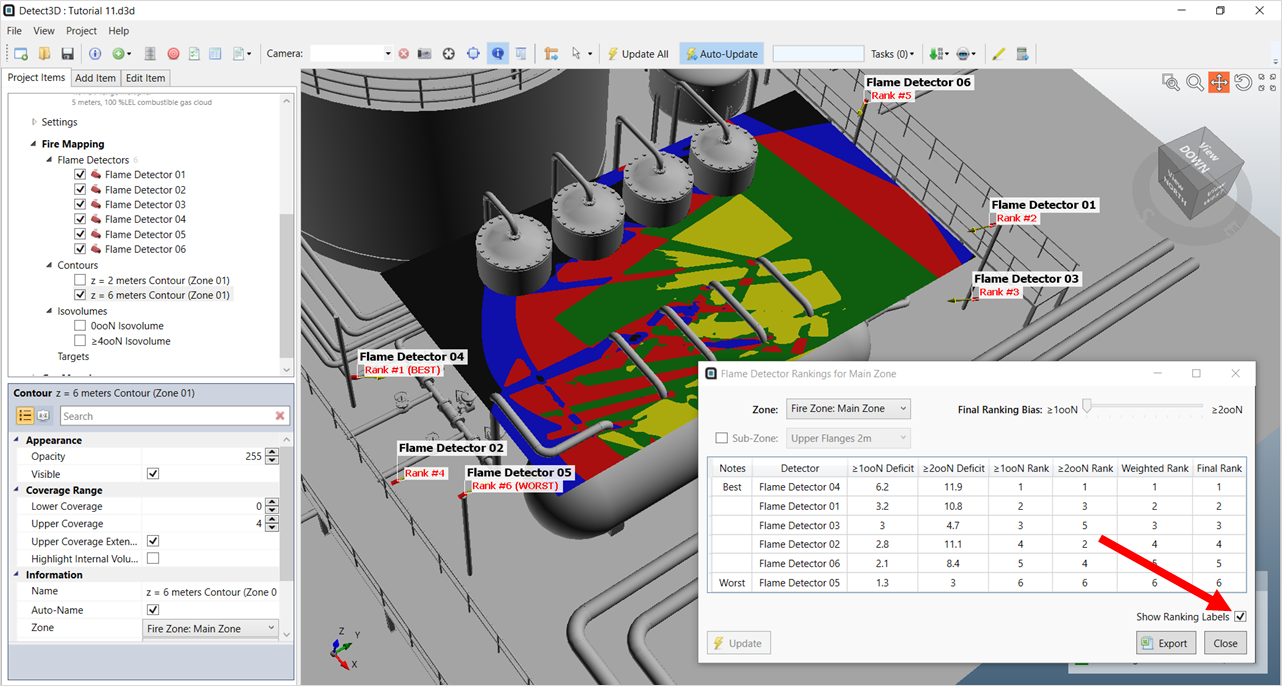
Tutorial 11 - Figure 08 - Displaying the ranking labels for the detectors in the analysis
In the next section we will start disabling detectors to see the effect on the rankings and coverage results.
The rankings tool gives indication on what the coverage will be if a detector is removed from the coverage calculation. As an example, from the images above, we can estimate that disabling Flame Detector 05 (the worst performing detector) will lower the Main Zone's 1ooN coverage by 1.7%, and 2ooN by 3.2%.
Close the rankings window before continuing.