Transient inflow profiles
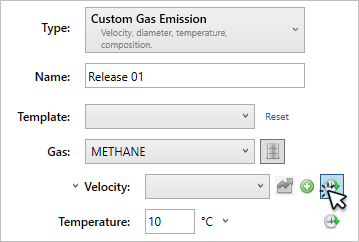
Inflow boundary conditions may have transient or time-based profiles added to them. If a clock symbol (![]() ) appears next to a property when defining an inflow then a transient
profile can be set. Options are available for both high pressure releases and custom gas emissions.
) appears next to a property when defining an inflow then a transient
profile can be set. Options are available for both high pressure releases and custom gas emissions.

Adding a Transient Profile to an inflow
Follow the steps below for an example on add a transient profile for the velocity of a custom gas emission:
-
When the clock symbol is selected, a previously defined transient profile may be chosen.

-
If there is not an existing profile, one can be made by selecting the plus icon (
 ).
). -
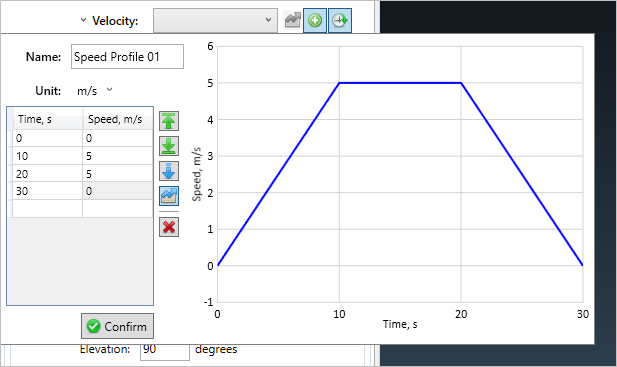
After selecting the plus icon, an editor window appears. Here you can add rows to add various values for the selected property. Double click the cell to edit the value. Clicking off the cell will confirm the value and add a new row. The below example added four rows and starts with a velocity value of 0m/s at t=0s then increases to 5m/s at t=10s it remains at this speed until t=20s, then decreases to 0m/s at t=30. When finished editing the profile, click the Confirm button.

-
Once confirmed, it will be selected as the transient profile to use for the simulation. The Plot Profile Button (
 ) will turn blue indicating that you can
view the graph of the profile. Continue adding the inflow to the project as normal.
-
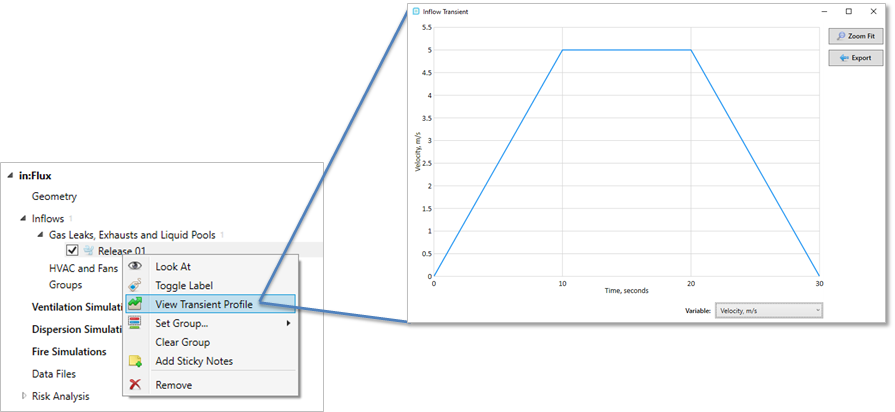
After adding the inflow to the project, the transient profile graph may be seen by right-clicking the inflow name and selecting View Transient Profile.

Other notes about transient profiles:
-
If this inflow is used in a steady state dispersion simulation, then the value at t=0s will be used.
-
If you run a transient simulation for longer than the transient profile time, it will use the last value entered in the transient profile, e.g. if the above case was used for a transient dispersion simulation lasting 60 seconds, then the transient profile will be used and the speed will be 0m/s from 30s to 60s.