Defining Porous Regions
What are Porous Regions?
in:Flux allows users to define a porosity volume to replace CAD pieces. This feature can be used when your project has CAD items such as:
-
grated decks
-
pipe racks or complex pipework
-
louvers
Rather than having the CFD code spend extra time refining calculations in and around these complex areas, porosity replaces the region with an equivalent volume which allows a percentage of the flow to travel through.
-
This percentage is defined as a value between 0 and 1
-
A value of 1 represents a fully open volume, as if the CAD pieces did not exist at all
-
A value of 0 represents a closed fully solid volume
Types of Porous Regions used in in:Flux?
Grated Deck: Area-based porosity
-
Defined as an axis-aligned cuboid region with a porosity value in one direction (x, y, or z)
-
For most all cases, grated decks will have a porosity value entered in the z-direction
-
A porosity value of z=0.9 is typical for grated decks
Porous Region: Volume-based porosity
-
Useful for non-grated deck applications where the porosity value is applied in all directions throughout the defined volume
-
A rotation value can be applied to the porous region volume to rotate the volume off-axis
How to Define a Porous Region in in:Flux?
The following adds a porous region to act as a grated deck using area based porosity. From the Add Items Tab, select “Porous Region” from the available options, located under Geometry.

When you define a porous region, all geometry within that region is disregarded i.e. the porous region replaces the geometry. Thus, for a grated deck you must position the porous region only over the geometry that is representing the grating. In the figure below, a solid deck was modeled in the CAD geometry instead of a grated deck. To define the deck to be grated in in:Flux, the porous region option was selected from the Add Items Tab and two opposing points for region were selected using the pick-tool (as would be done for a monitor region). The preview was used to verify the thickness of the porous regions encompassed the geometry representing the plating of the deck and was not inclusive of the structure.

When the porous region is added to the project it will appear as translucent yellow in the 3D window and will appear in the Project Items Tab under the geometry options. Now when ventilation and dispersion simulations are calculated this region will use the porosity value entered rather than the defined geometry.

For complex decks, multiple cuboid regions can be defined. In the below example five porous regions were defined.

Important Note: if you define a porous region after simulations have finished calculating, you will need to rerun them.
Volume Based Porous Regions - Replacing CAD equipment
In addition to grated deck definition, porous regions can be used to replace CAD items in the geometry. Doing so is only recommended for CAD items that are far-field or away from the analysis region - such as replacing buildings or other modules on the far side of the facility. It is important to keep the original CAD around the region which will have leaks defined.
For this example three porous regions will be defined on the lower deck of the offshore rig. This is done to expedite the calculation as a whole and as the analysis region (where the leaks will be defined) are separated from these areas (indicated in the figure below) by the large main deck which is represented as plated for this example.
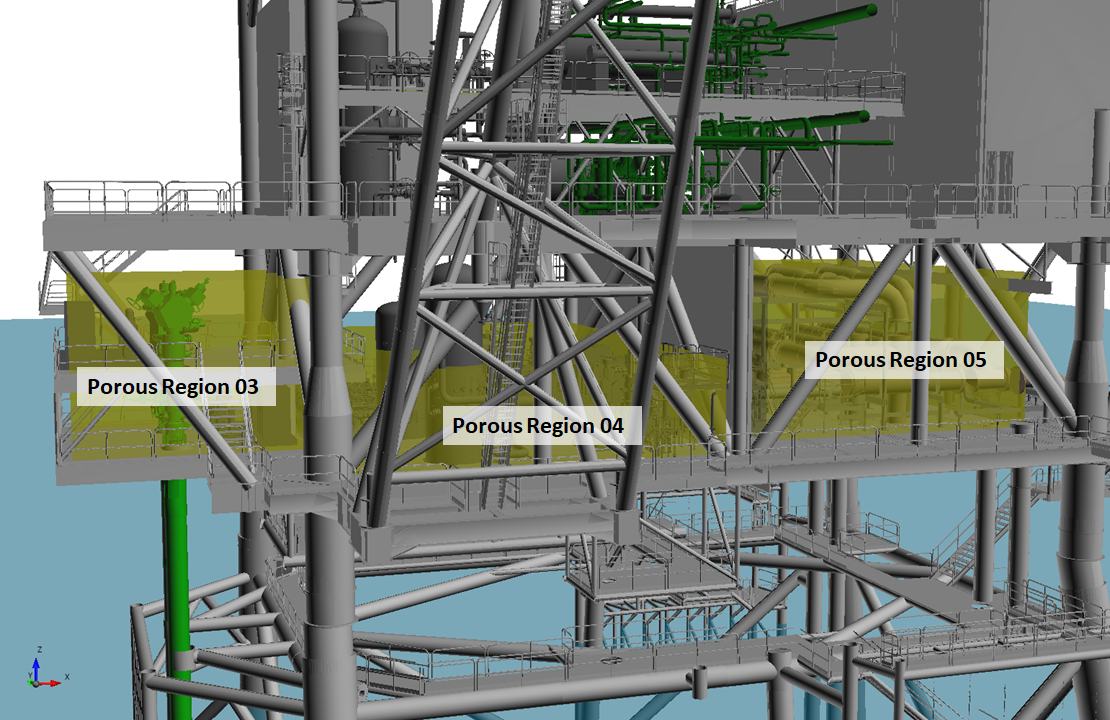
Tutorial 19 - Figure 5 - Location of 3 volume based porous regions replacing CAD items
Sensitivity Study Workflow for Determining Porosity Values
Volume based porosity allows for a percentage of flow to pass through in any direction - this is different than area based which is only in one direction. It is important to determine the correct value to use which will most closely represent the CAD. A sensitivity study can be performed looking at different ventilation cases to calculate the porosity value to be used.
The following steps were performed for a sensitivity study for this example to determine the porosity to use for each of the three volume based porous regions. Feel free to go through these steps on your own with this model or use the values provided at the end:
-
Save the projects as a new test file
-
Determine 1-2 prevalent wind cases to asses and define them in the test project
-
Add a streamline visual when complete with the Seed Line passing through the area where the porous region will be placed
-
save a screen shot of various viewing angles of the visual and save the camera to reference later. These images will be our baseline which we will want to match.
-
Now define a porous region to encompass the area which you are investigating - use the two definition points to define a cuboid volume over the area and enter a porosity value of 0.9 to start.
-
Once the test porous region is added to the project, reset and re-run the ventilation cases defined earlier. The goal is to determine a porosity value which will make the streamlines most closely match that of the original ventilation using the full CAD model.
-
When the simulation completed review the saved camera angles and compare the new streamline result with the baseline case.
-
Repeat steps 5 through 7 for various porosity values from 0.4 to 0.9. Which produces streamlines closest to that of the baseline case? Generally onshore facility will have values closer to 0.9 and offshore facilities will be less.
Note that the porosity values obtained above are highly dependent on the definition points for the porous region, especially the z-coordinate providing the height of the region.