Adding a Vector Field
A vector field in in:Flux is a plane of spaced vectors which are colored based on the velocity magnitudes present in the simulation they are assigned to. They can be used in combination with other post-processing options.
To add a vector field:
-
Click the Add Item tab and select Vector from the dropdown menu.
-
Leave the name to its automatically generated name.
-
Select the Westerly, 5 m/s as the Simulation.
-
Choose the On Plane option to be XY Plane.
-
Set the Offset at: value to "1.5" meters.
-
Leave the Relative to: value set to Domain.
-
Set the Type to Arrow
-
Click the Preview checkbox. The screen should appear similar to Figure 25 below. Vectors are colored and sized according to the value of the variable at the vector point. Notice how regions of re-circulation with lower velocity magnitude have smaller arrow vectors, as indicated by the red boxes. We can change the vectors to be all the same size by normalizing them.

Tutorial 1 - Figure 25 - Preview of a vector field placed on the XY plane at a 1.5m height.
-
Click the Normalized checkbox next to the Type dropdown menu to make all the arrows the same size.
-
Enter a Magnification value of "1.0".
-
Leave the Coloring options in their defaulted selection.
-
Click the Add Item button.
The larger vector arrows sometimes provide a better visual reference for the direction of complex flow, as shown in Figure 26.

Tutorial 1 - Figure 26 - Added normalized vector field of velocity magnitude on the XY plane at 1.5 meters height. Legend has been 'linked' to the vectors
You can 'link' the legend to different visualizations so that the units and bounds of the legend contain the appropriate data. To do this, right-click the visualization item you want the legend to link to (for Figure 26 above, the vector visualization
was selected) and choose Link to Legend from the dropdown menu, as shown in Figure 27 below. The link icon (![]() ) will appear in the project items panel under the
text of the visualization which the legend is linked to.
) will appear in the project items panel under the
text of the visualization which the legend is linked to.
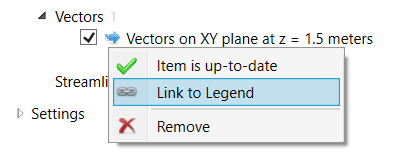
Tutorial 1 - Figure 27 - Indication of where to click to link a visualization with the legend.
You can combine the visibility of visualizations in the 3D window to create unique images. From the Project Items tab, with the vectors are still showing from the previous steps, turn on the visibility of the contour by selecting the checkbox next to its name. Displaying both the vector field and contour, since each is defined at 1.5m height, provides us an indication of the direction of the flow at various points throughout the contour as in Figure 28 below.

Tutorial 1 - Figure 28 - in:Flux window showing both a contour and vector field for the Westerly ventilation simulation.
Before continuing to the next section, turn off the visibility of the vector field and contour by deselecting it in the Project Items Tab.