Simulation Monitor
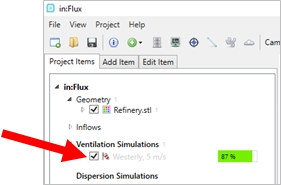
Under the Ventilation Simulations header in the Project Items Tab, there should now be a single item listed with a name and description matching the simulation that was just initiated in the last section. The text will be colored gray until the calculation has completed, as shown below. To the right of the text, a green status bar will appear indicating percent completion of the simulation.
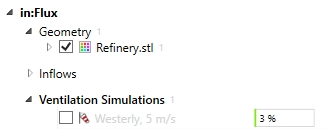
Tutorial 1 - Figure 09 - Indication of Westerly wind simulation listed in the Project Items Tab with 3% completion
Click the checkbox next to the westerly ventilation simulation text in the Project Items tab. This will display the automatically sized domain in the 3D window as well as a red arrow showing the direction the wind is blowing. Your screen should appear as Figure 10 below at this stage.
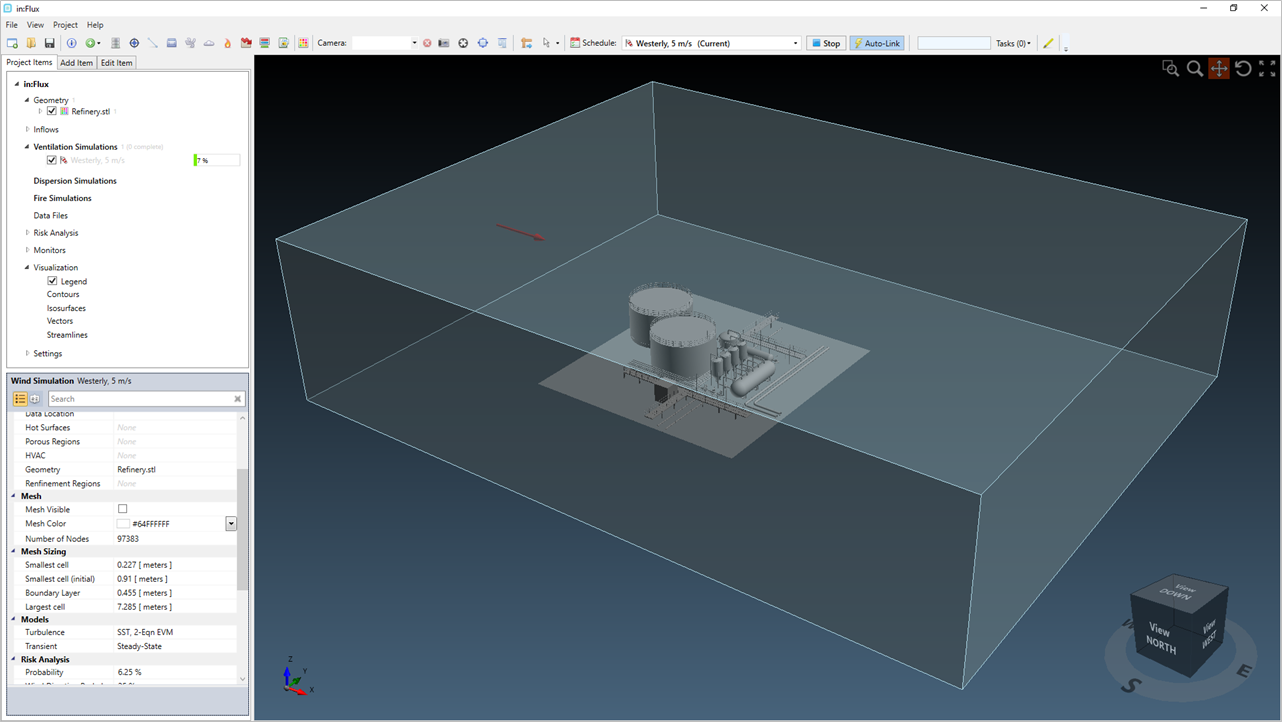
Tutorial 1 - Figure 10 - Defined domain for the given ventilation simulation. The simulation is at 11% completion in this image.
Right-click on the westerly ventilation simulation and select Toggle Mesh from the menu that appears as indicated in Figure 11. This will display the currently calculated mesh. You can see in the 3D window that there is more refinement around the geometry than at the extents of the domain. As the calculation continues, the mesh will refine around regions of high gradients. In our example we will get mesh refinements downstream of the geometry.
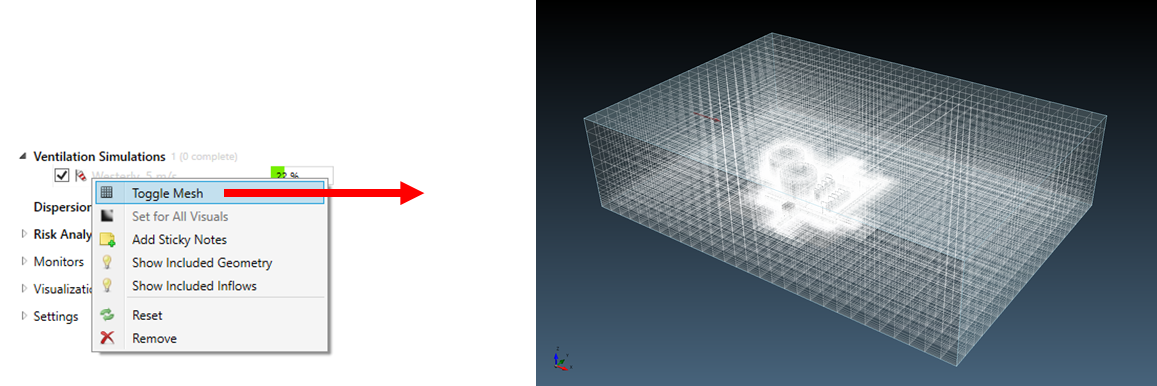
Tutorial 1 - Figure 11 - Toggling the mesh visibility from the right-click menu in the project items tab. Image is of the initial mesh, calculation is at 22% and will change as calculation progresses
We can get a better understanding of the meshing by switching the view in the 3D window:
-
Right click in the 3D window and under the Projection option, select Orthographic. Alternatively, you can press Ctrl+P, both methods will remove the perspective from the 3D window.
-
Right click in the 3D window again and under the View From option, select Front View. Your screen should be similar to the image below, the mesh will vary depending on the completion of the calculation. The end of this section has a series of figures comparing the mesh at the start and end of the calculation.

Tutorial 1 - Figure 12 - Front view of the 3D window after switching to Orthographic and selecting a 'front' view. Image taken at 51% completion.
From Figure 12's view you can see the variation of the mesh with height within the domain due to the boundary-layer grading from the ground to capture the high velocity gradients near the ground.
Change to a birds-eye-view by right-clicking in the 3D window and changing the View From option to Top View as shown in Figure 13 below. From this angle it easier to see the mesh refinement as well as contours of the simulation via the Simulation Monitor which will be looked at next, the mesh will vary depending on the completion of the calculation.

Tutorial 1 - Figure 13 - Top view of the mesh refinement. Image taken at 68% completion of the simulation.
During any calculation in in:Flux you can open the Simulation Monitor to view current residual values and to preview the mesh and currently calculated contours.
The Simulation Monitor can be accessed by double clicking the gray text of the simulation you want to view, listed in the Project Items tab.
Proceed by opening the Simulation Monitor. in:Flux ventilation simulations are fairly quick, depending on your computer, the calculation may have already finished by this time. If your simulation has already completed, you may choose to add another ventilation to the project and return to this point to watch the simulation while the calculation is running or you can continue following the steps below with the completed simulation data.
While the simulation is initializing (within the first few seconds of adding the simulation to the project), the window will appear as the figure below, values of 0.00e00 will be set for the residuals and the contour icon will be in grayscale.
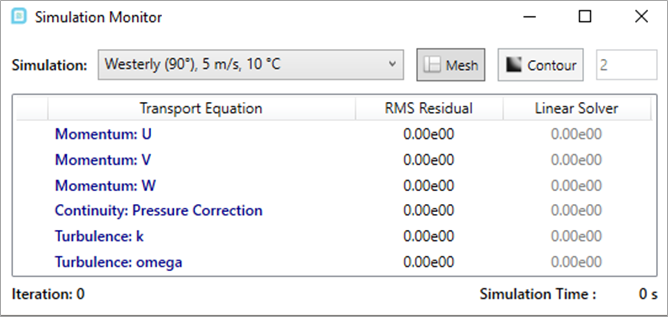
Tutorial 1 - Figure 14 - Simulation Monitor during initialization, before calculation has started.
After initialization, the simulation will start. The green arrow on the left-hand side of the Simulation Monitor indicates which equation in:Flux is currently solving for. You can follow the RMS Residual and Linear Solver values here, the more pertinent being the RMS Residual value.
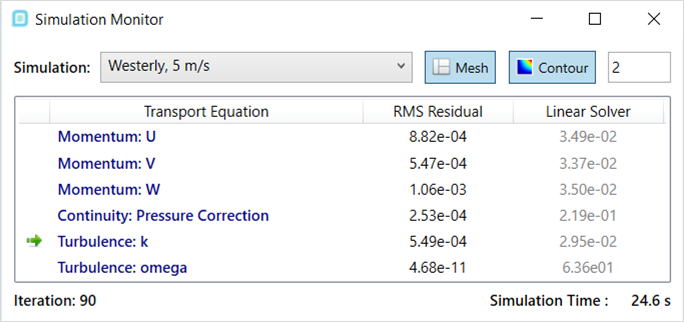
Tutorial 1 - Figure 15 - The Simulation Monitor window 24 seconds after the calculation has started.
From the Simulation Monitor, you can preview a contour of the simulation data:
-
Ensure that the Contour box is toggled 'on' (indicated by a blue box surrounding the text
 )
) -
Ensure a value of "2" next to the Contour button. This textbox sets the distance above the defined ground that the contour will be displayed.
-
Left click on the Momentum: U text listed under the Transport Equation column. Your screen should appear similar to Figure 16 below. The look of the contour as well as the coloring will vary depending on what percent completion you have - this is not the final solution. From the Simulation Monitor all previewed contours are on the XY plane, thus a Top View is best for viewing this data. When the simulation is complete, you can add contours on any of the Cartesian planes via the Add Items tab, which will be discussed in the next section.

Tutorial 1 - Figure 16 - Picture of mesh and contour of the momentum equation in the U direction placed at 2 meters height at 86% completion of the calculation.
-
Click the Mesh button (
 ) in the Simulation Monitor to toggle off the mesh and click through the
other transport equations. Notice that both the mesh and the previewed contours continue to update as the calculation progresses. For this simulation, the mesh has refined itself more on the right side of Figure 16 as the gradients are higher
downstream of the simulation where wakes are present in the flow.
) in the Simulation Monitor to toggle off the mesh and click through the
other transport equations. Notice that both the mesh and the previewed contours continue to update as the calculation progresses. For this simulation, the mesh has refined itself more on the right side of Figure 16 as the gradients are higher
downstream of the simulation where wakes are present in the flow. -
While the simulation is running, you can preview contours at any height within the domain. Click the Momentum: U text and enter a value of "4" in the text box next to the Contour button to change the height of the previewed contour. You may only enter values that are within the defined domain (seen in Figure 10).
-
In the Project Items Tab, uncheck the checkbox next to the ventilation simulation to turn off the visibility of the domain.
Tutorial 1 - Figure 17 - Indication of the checkbox to uncheck in the Project Items tab
-
Press Ctrl+P to change back to a perspective view or select Perspective from the Projection option in the View Menu.
-
Take some time to rotate the geometry to different positions to view different parts of the contour until the simulation has finished calculating. No matter what view you have in the 3D window, it will not affect the calculation or updating of the contour or data.
-
Close the Simulation Monitor when the ventilation simulation has finished. This will be indicated by a
 message listed next to the ventilation simulation text in the Project Items. The font of the simulation will also change to black. Closing the Simulation Monitor will remove any previewed contour displaying
in the 3D window.
message listed next to the ventilation simulation text in the Project Items. The font of the simulation will also change to black. Closing the Simulation Monitor will remove any previewed contour displaying
in the 3D window. -
If the mesh is still showing, turn its visibility off by right-clicking on the Westerly, 5 m/s text and choosing "Toggle Mesh".
You have now completed your first CFD simulation using in:Flux! Continue to the next section to learn about the varying post-processing capabilities available.
As a reference, below are duplicates of Figures 18, 19, 20 and 21 at the start (left) and the end (right) of the simulation.
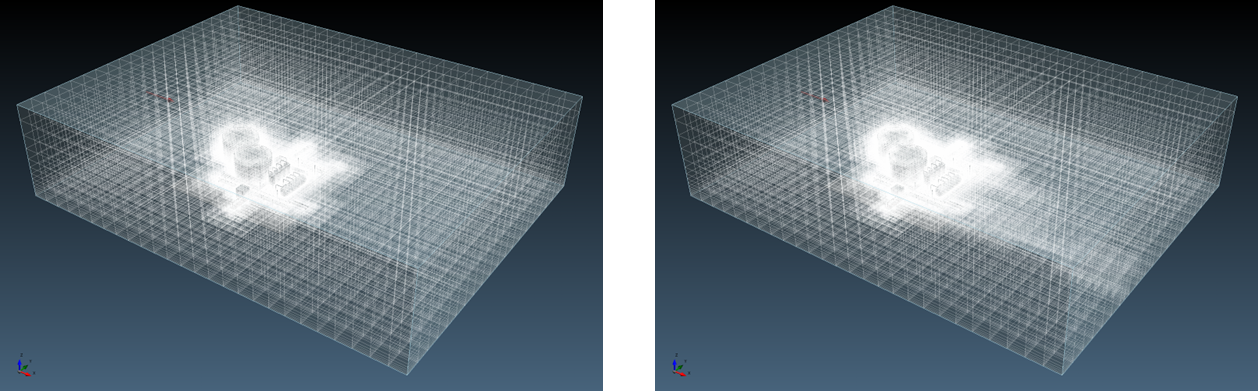
Tutorial 1 - Figure 18 - Isometric view of mesh at start of the simulation (left) and end of the simulation (right)
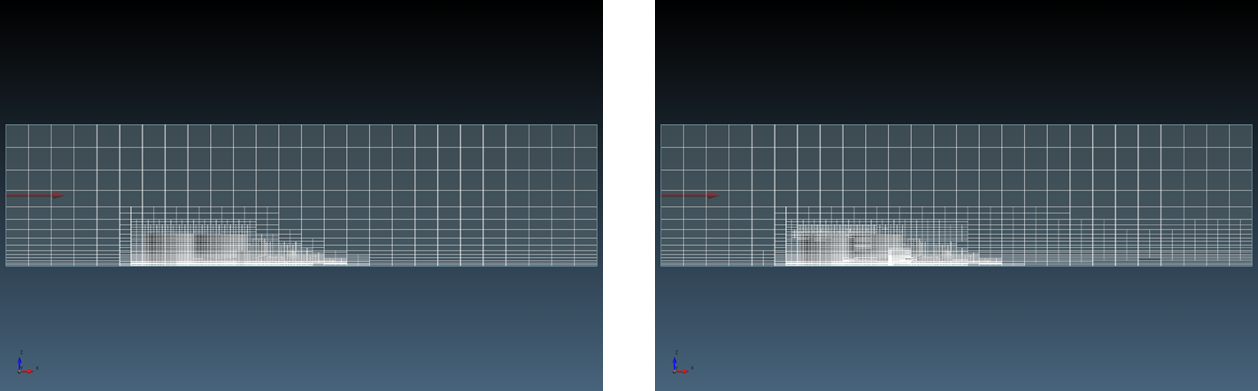
Tutorial 1 - Figure 19 - Comparison of FRONT view of the mesh for the Westerly, 5m/s ventilation case
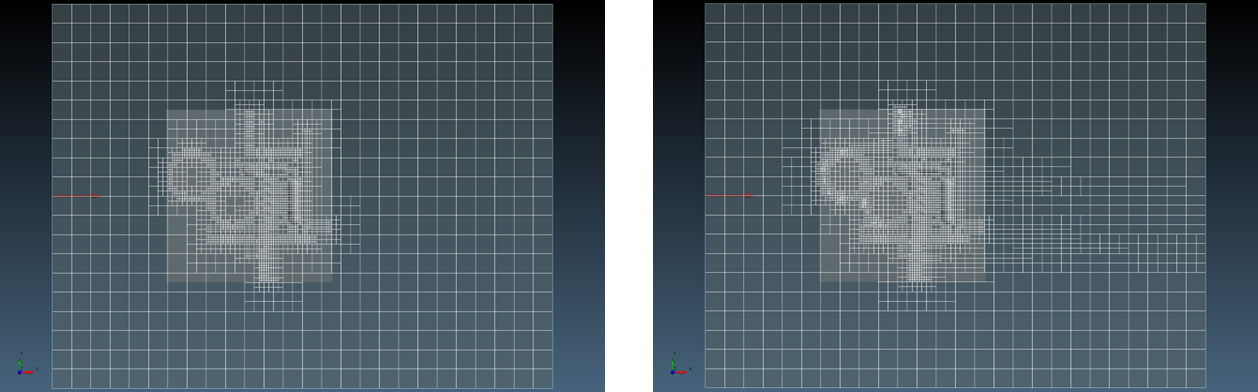
Tutorial 1 - Figure 20 - Comparison of the TOP view of the mesh for the Westerly, 5m/s ventilation case
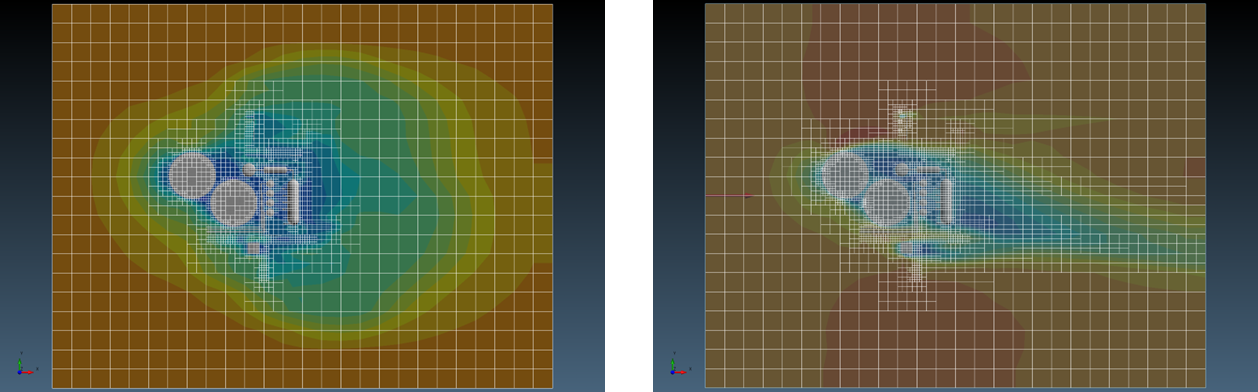
Tutorial 1 - Figure 21 - Contour comparison from a TOP view. The left image is at a 4% completion, the right image is at 100% completion