Adding a Monitor Line
In addition to just spot or point measurements, in:Flux can provide data along a defined line. This data across the line can be displayed for any variable in the simulation in one of four ways:
-
The average value of the variable across the line
-
The minimum value along the line
-
The maximum value obtained on the line
-
The integrated value across the length of the line
This data is all displayed in the Monitor Point Line Data window and can be used to represent things such as an open path gas detector.
Follow the steps below or watch this video for defining a monitor line for your project:
To add a monitor line to the project:
-
Click the Add Item tab and select Monitor Line from the dropdown menu
-
Change the Name to "Monitor Line - East Perimeter"
-
Enter the following values for the first point: X as "20" Y as "-8", and Z as "2"
-
For the second point, enter and X value of "20" Y as "39", and Z as "2"
-
Leave the color as chartreuse (
 )
) -
Set the Purpose is set to Data Collection
-
Select the Preview checkbox to verify that your screen resembles Figure 18 below.
-
Click the Add Item button to add the monitor line to the project
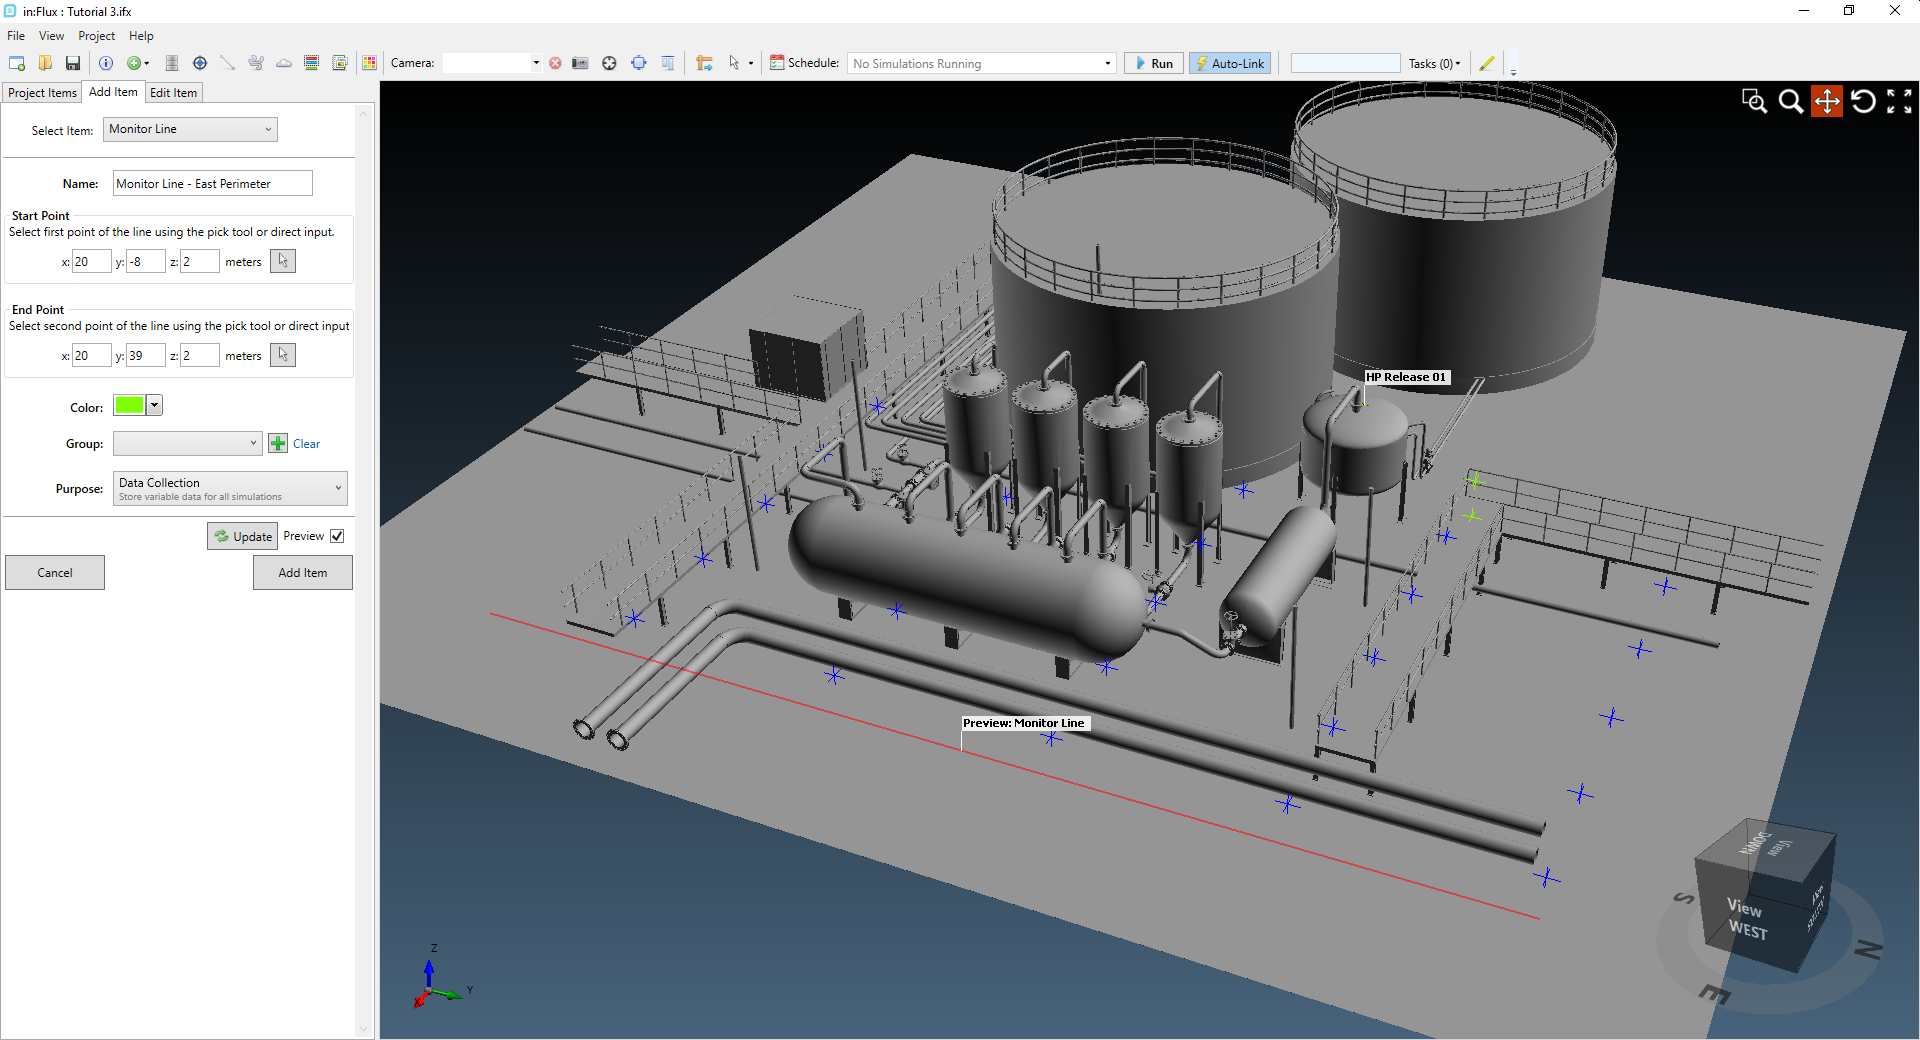
Tutorial 3 - Figure 18 - Showing the preview of the monitor line to be added to the eastern perimeter of the facility
Once added to the project, the monitor line will be listed in the Project Items tab and have gray text until the data has been updated. If it appears with black text, check that the purpose is set to Data Collection.
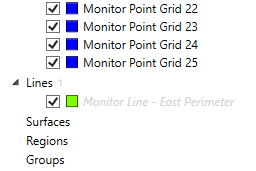
Tutorial 3 - Figure 19 - Showing the monitor line added to the Project Items tab under the monitor points
Continue to the next section to view the data of the monitor line.