Ventilation Analysis Data and Congestion Ratio
Once a monitor region has been defined and a ventilation simulation run, you can view the ventilation analysis data.
To open the ventilation analysis window:
Select Ventilation Analysis from the Project menu, or select the ![]() icon on the toolbar. If a window pops up saying "Some data for the
monitor regions is not up to date," click OK, and then click the Update button (
icon on the toolbar. If a window pops up saying "Some data for the
monitor regions is not up to date," click OK, and then click the Update button (![]() ) in the upper right corner of the window.
) in the upper right corner of the window.

Tutorial 3 - Figure 33 - Ventilation Analysis Window showing Air Changes Per Hour for each of the monitor regions.
When performing safety analysis studies, it is often useful to know the Air Changes Per Hour or the Average Velocity across the monitor region. The air changes per hour is calculated by looking at the “volume flux” into the region. The faces of the monitor regions are split up into individual areas. Velocities are then calculated for each of these areas. The volume flux is then the summation of the velocities. Air change is then the volume flux divided by the total volume of the monitor region. The average velocity is simply the average wind speed across the entire monitor region.
As with the other monitor data windows, you may export the data from this window to excel. The data will have more significant digits than that of the ventilation analysis window.
Congestion Ratio
The congestion ratio is calculated for each defined monitor region. This information is seen via the properties panel, Figure 34 shows the Facility Monitor Region has a congestion ratio of 0.139.
For in:Flux the congestion ratio is calculated as the total equipment volume within the monitor region divided by the total volume of the monitor region. The calculation of the congestion ratio takes a couple of seconds so if a value doesn't immediately appear check back after 10 seconds, this will be longer for more complicated geometries.

Tutorial 3 - Figure 34 - Indication of location of the congestion ratio for the Facility Monitor Region.
If the Monitor Region name has gray text in the Properties Panel (as in Figure 35), the region needs to be updated. This can be done by right-clicking on the name in the project items tab and choosing Regenerate as shown below.
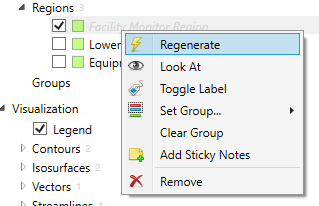
Tutorial 3 - Figure 35 - Context menu for monitor region indicating how to regenerate the data
This completes Tutorial 3. You should now have an understanding of how to extract data from monitor points, lines and regions.
Save you working file as it will be used next in Tutorial 4.