Viewing Monitor Line Data
Similar to the monitor points, monitor lines can be added before, during, or after the simulation has been calculated.
Once defined, you can view the tabulated data in the Monitor Line Data window. To open, select Monitor Line Data from the Project menu, or select the ![]() icon on the toolbar.
icon on the toolbar.
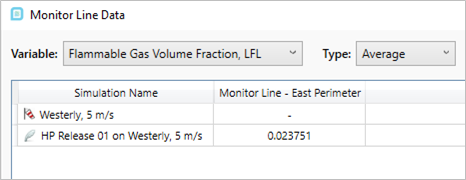
Upon opening the window, a warning window will appear as the data has yet to be updated, click OK, and then click the Update button (![]() ) in the upper right corner. After the data has been acquired from the memory, your window should appear as Figure 20 below.
) in the upper right corner. After the data has been acquired from the memory, your window should appear as Figure 20 below.

Tutorial 3 - Figure 20 - Monitor Line Data Window, image is cropped to upper left corner only (hiding exceedance, export and update buttons)
Notice here that the major difference from the Monitor Point Data Window and the Monitor Line Data Window is that there is a Type: dropdown menu which lets you select the type of data displayed in the window. In Figure 20, the Average value of the Flammable Gas Volume Fraction, LFL is being shown so there is no value listed for the Westerly, 5m/s case.
The options to choose from the Type dropdown menu are below. All four options are available for any Variable chosen in the simulation.
-
Average - cells display the average value calculated across this monitor line
-
Min Value - cells display the minimum value obtained on the monitor line
-
Max Value - displays the maximum value obtained on the monitor line
-
Integrated - cells display the integrated value calculated across the length of the monitor line, units should be in "X.m" where X is the variable chosen. The Integrated option normally is used with the the Volume Fraction, LFL variable (without the %).
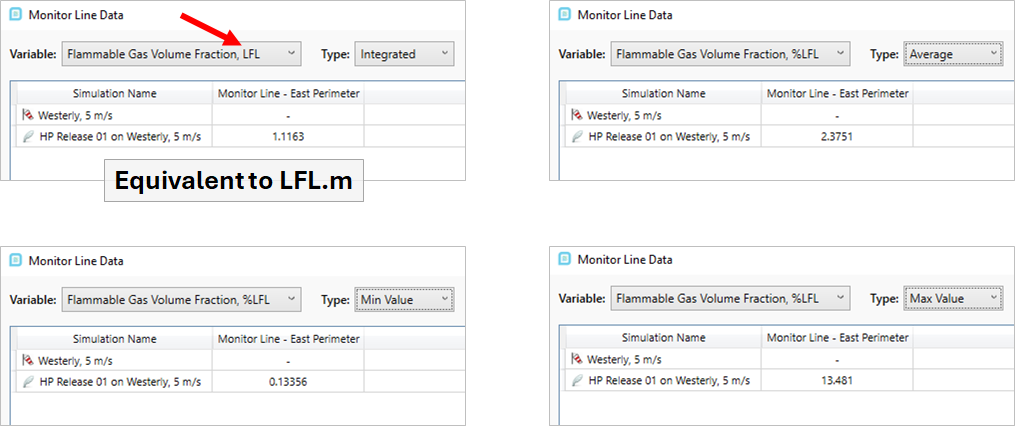
Figure 21 shows results for the Integrated, Average, Min and Max values for the Flammable Volume Fraction. Note the variable was changed for the Integrated option to "...., LFL" to show LFL.m values, the other values are with the variable "..., %LFL". As with monitor points, all data is saved once the simulation has completed.

Tutorial 3 - Figure 21 - Comparison of 4 Types of data stored in Monitor Lines: Average, Min Value, Max Value, and Integrated Value (integrated value uses Volume Fraction, LFL and not %LFL)
Continue to the next section to add a Monitor Region to the project.