Editing the Legend
In addition to editing and manipulating the visualization of in:Flux, the legend may be edited to best fit your needs.
Legend properties can be changed before or after a visual has been linked. Linked visuals have the  icon next to their name.
You can access the properties of the legend by selecting the name Legend in the Project Items tab, under the Visualization header
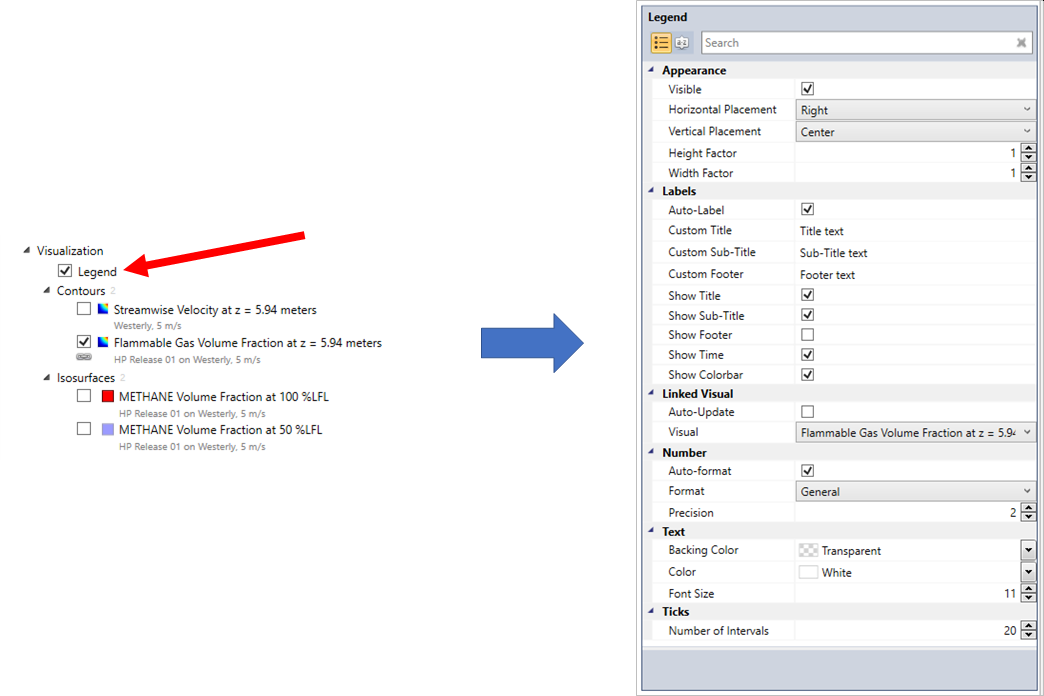
Red arrow indication location to click to show the legend properties panel (right)
The sections of the properties panel are listed and described below.
Appearance
Visible - a toggle option for turning the visibility of the legend on and off
Horizontal Placement - changes the horizontal placement of the legend to be on the left side of the 3D window rather than the defaulted right side.
Vertical Placement - changes the verticle placement of the legend. Options of top, center or bottom. The placement in some locations will accomodate the view cube, axis indicator (bottom left) and mouse cursor maneuvering buttons (upper right).
Height Factor - a multiplier for the height of the legend. A value of 1.0 returns to the default height. The below image shows the resulting legend when the Height Factor is 2.0 - values higher than this will have no effect.
Width Factor - similar to height factor, a multiplier value for the width of the legend. Enter 1.0 to return to the default width. The below image shows a width factor of 3.0
Labels
Auto-Label - a toggle checkbox option, when selected in:Flux will automatically choose the title and sub-title of the legend and ignore the custom options listed below. Toggle to OFF to show the custom entered text, if doing so ensure the desired checkboxes are selected for the various custom text options to be shown (i.e. the Show Footer checkbox is defaulted as unchecked, you will need to select the checkbox for the custom footer text to appear in the 3D window)
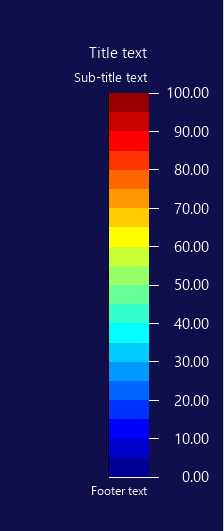
Legend view with Auto-Label turned off and footer visible. Change the Custom options below to edit the text
Custom Title - Enter text here to replace the custom title, ensure that the auto-label is switched off
Custom Sub-title - Enter text here to replace the customer sub-title, usually shows the until of the legend values
Custom Footer - text to appear at the footer of the legend, the footer is hidden by default. If toggled on and auto-label selected, the footer will display the name of the visual the legend is linked to
Show Title - Global toggle option to display on or off the title of the legend
Show Sub-title - Global toggle option to display the sub-title of the legend
Show Footer - defaulted to being off, the global toggle for displaying the footer of the legend
Show Time - for transient simulations the time (in seconds) will be displayed under the sub-title text
Show Colorbar - toggles the colors shown in the legend as for some applications just the variable and units may want to be shown on the screen.
Linked Visual
Auto-Update - Updates the legend when visuals are switched on and off, i.e. the legend will disappear when the visibility is turned off for the visual it is linked to
Visual - a dropdown menu populated will all of the currently defined visuals of the project, represents which visual the legend is linked to
Number
Auto-Format - checkbox which lets in:Flux set the number of digits displayed based on the variable chosen
Format - defaulted to 'General' notation, users may opt to change this to scientific notation
Precision - number of digits past the decimal that is displayed in the legend regardless of the format selected. Applied if Auto-Format is toggled off.
Text
Backing Color - the background color for the legend text, defaulted to transparent.
Color - the color of the legend text, defaulted to white
Font Size - size of the legend text, defaulted to 11
Ticks
Number of Intervals - sets the number of intervals used for continuous color maps
Legend and Isosurfaces
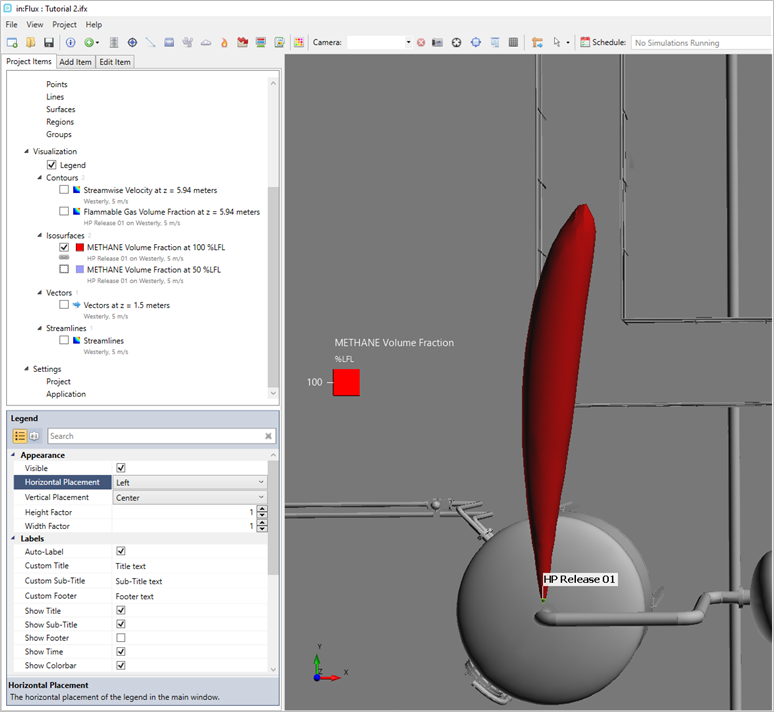
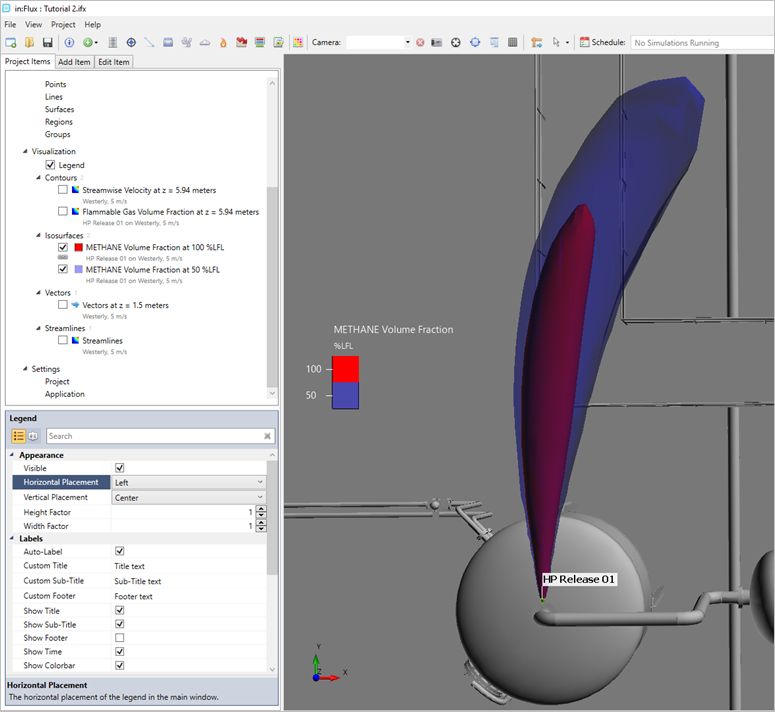
As of version 3.1 the legend can be linked to isosurfaces and displayed in the same manner as with other visualizations. Below shows that two isosurfaces are selected in the Project Items and appear in the 3D window. After linking the isosurface to the legend, the corresponding %LFL color and value is shown in the legend for each visible isosurface.
If only one isosurface is shown in the 3D window then only that isosurface's value and color will appear in the legend.