User Defined Max and Min Values
When defining post-processing visualizations, in:Flux will automatically choose the maximum and minimum values based data from the selected simulation. Users may override these values via the properties panel of the defined visualization.
Located in the Color Map section of the properties panel:
-
Click the small triangle next to the Color Map header in the properties panel of a visualization item.
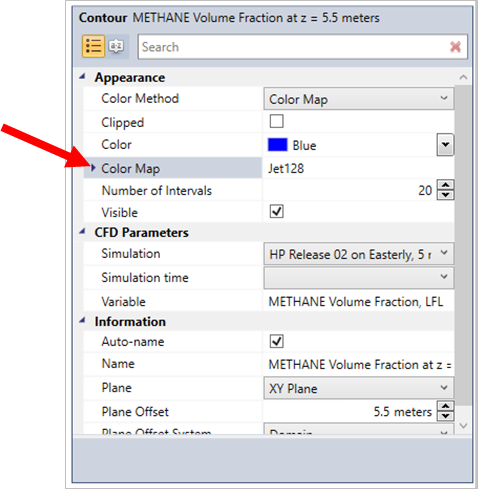
Tutorial 6 - Figure 22 - location for expanding the Color Map section
-
Uncheck the Use Variable Min / Max checkbox as indicated in the figure below. The term variable in this panel represents the variable automatically chosen by in:Flux. Un-selecting this checkbox may result in a small delay to update the contour as in:Flux will be pulling data from memory.
-
Enter your own values for the maximum and minimum in the User Maximum Value and User Minimum Value text boxes. The default user maximum is 1 and user minimum is 0.
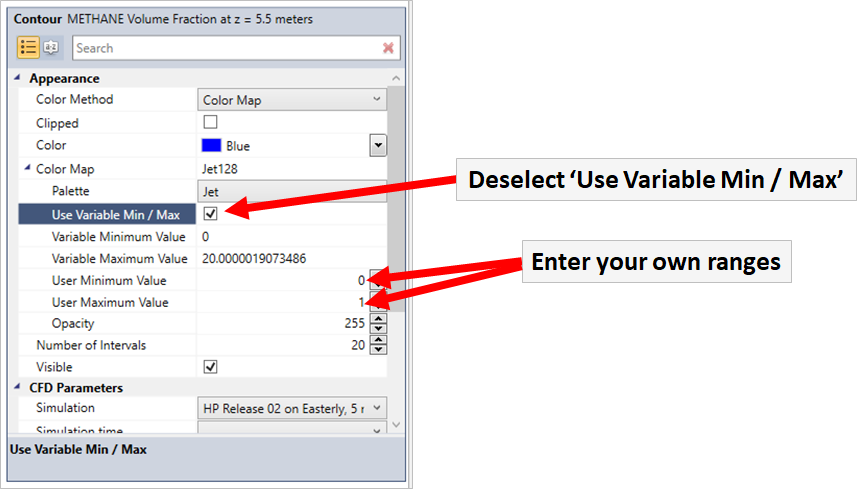
Tutorial 6 - Figure 23 - Process for selecting User Defined ranges for an already defined contour
The above images have changed to a user defined maximum and minimum values for a contour showing the mass fraction of a gas release, however the same process can be used for ANY post-processing visualization - contours, vectors, isosurfaces and streamlines.