Adding a Contour for 'Bulk Properties'
-
From the Add Items tab, select Contour from the Select Item dropdown menu.
-
Set the Simulation as HP Release with H2S on Westerly, 5m/s
-
Click the Variable dropdown menu to see that variables such as volume/volume, percent volume and parts per million (ppm) exist for each component as well as the bulk mixture. Additionally, the LFL and UFL values for the gas are available. Scroll to and choose Mixture from Tutorial 7 Volume Fraction, %LFL as seen in the Figure 20. For the bulk property the Flammable Gas Volume Fraction, %LFL may also be used here.
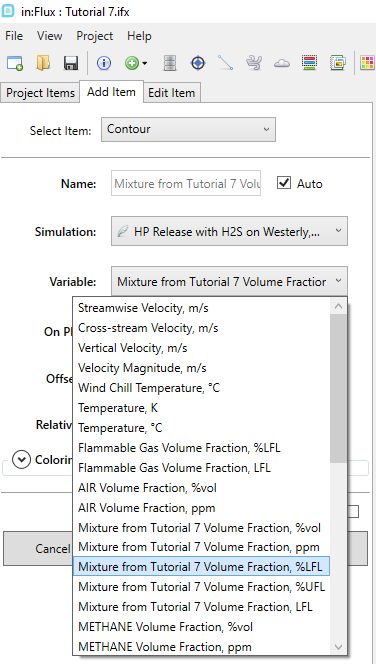
Tutorial 7 - Figure 20 - Selection of bulk %LFL for the gas mixture
-
Using the XY Plane as the On Plane value, enter the height of the inflow - "5.5" as the Offset At value.
-
Set the Relative to value as Domain
-
Open the Coloring section and set the Range to User-Defined and enter a value of "0" and the Min value and "100" as the Max value. Your screen should match Figure 21 below. This will set the range of the contour to be from 0% - 100% LFL .

Tutorial 7 - Figure 21 - Using the Coloring dropdown options to set a User-Defined range for the %LFL contour
-
Click the Add Item button
-
In the Project Items tab, right-click on Mixture from Tutorial 7 Volume Fraction at z = 5.5 meters and select
 Link to Legend to have the legend sync to this contour and appear on the 3D window as in Figure 22.

Tutorial 7 - Figure 22 - Contour of %LFL for the bulk mixture
Opening the 'Color Map' section in the properties panel of the contour will enable you to change the coloring method of the contour. In Figure 23 the contour was clipped to have a range from 10 to 100% LFL, the Number of Intervals was set to "40" and the palette was changed to Parula. You may set the color map and opacity in the Coloring dropdown section when adding the contour or via the contour's properties panel. Refer to the contour section of Tutorial 6 for steps to edit the varying properties of the contour.

Tutorial 7 - Figure 23 - Editing the contour for visualization purposes
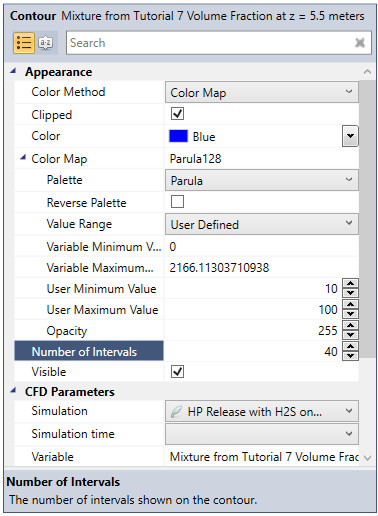
Tutorial 7 - Figure 24 - Properties panel showing values used for Figure 23 above: Clipped was selected, User Minimum was changed to 10, Palette set to Parula and Number of Intervals was set to 40