Transient Gas Cloud Data
As monitor regions have already been defined in the Tutorial 3 file, they are automatically updated when the transient simulation completes. You may also add monitor regions after simulations are complete and still view the transient results.
-
Open the Gas Cloud Analysis window by selecting the
 icon from the toolbar or Project Menu.
 -
The Facility Monitor Region should already be selected. Double-click on the cell corresponding to the Equivalent Stoichiometric Volume LFL-100% for the transient simulation, a graph similar to Figure 15 should appear. If you select a simulation without transient data, the graph will appear with text stating "no transient data". Alternatively, you may select the cell and click the
 button.
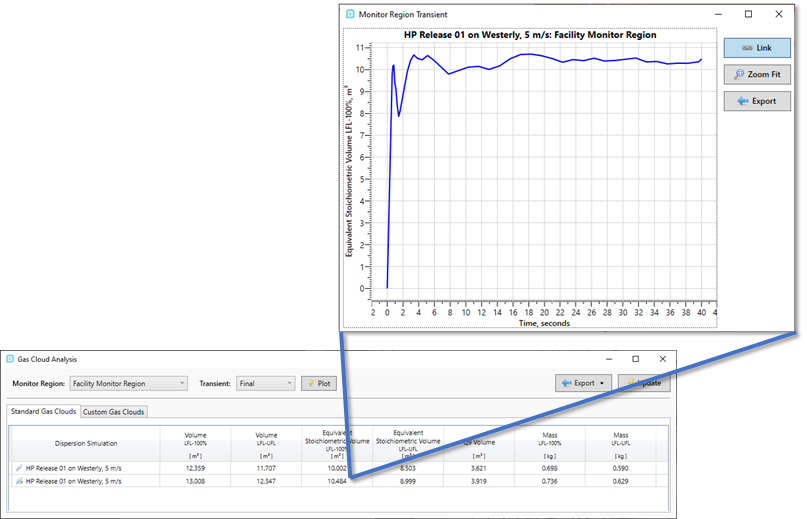
Tutorial 8 - Figure 15 - Viewing Gas Cloud Analysis transient data by double clicking a cell
-
Similar to the Monitor Point Data, this graph and associated values at the varying times can be exported to excel.
-
In the Gas Cloud Analysis window, change the Transient dropdown option to Max Value. What do you notice?
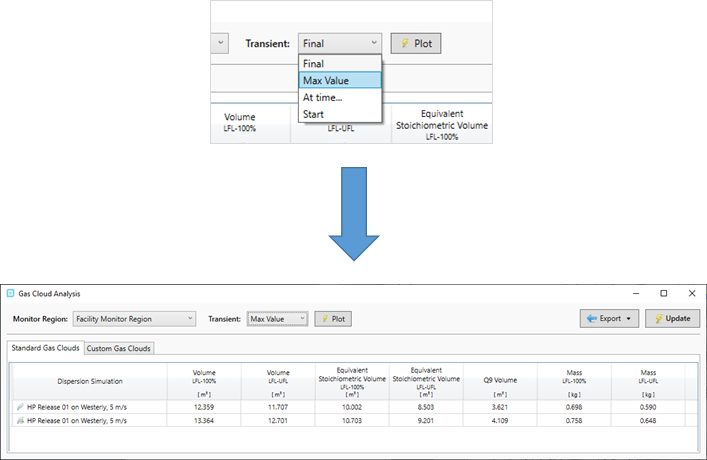
Tutorial 8 - Figure 16 - Changing the table to display the maximum value achieved during the simulation
-
For this case, the maximum value was achieved within 4 seconds of the release. As the release was directed towards a cross wind this can be expected. However, with more congestion near the leak having a larger gas cloud size later in the simulation (or even after ESD) is possible.
Continue to the next section to go over adding a shutdown time on a release.