Adding Contours for RSTM Visuals
Once a simulation using the RSTM has been completed, the Vertical Fluctuating Velocity, m/s variable will appear in the post-processing options.
This is the variable that is compared to the requirements of the CAP 437 studies - "...standard deviation of the vertical airflow velocity of 1.75m/s should not be exceeded." For the purposes of this tutorial, the value of 1.75m/s will be used. It is advised to review the full CAP437 requirements before performing this analysis as sometimes it is better to look at values closer to 1.5m/s.
To add a contour of the vertical fluctuating velocity:
-
Click the Add Item tab and select Contour from the dropdown menu.
-
The name of the contour is automatically set based on the variable selected.
-
Select the Northerly, 10 m/s as the Simulation for the contour.
-
Set the Variable to Vertical Fluctuating Velocity, m/s and leave the On Plane set to XY Plane .
-
Determine the elevation of the helideck by using the Measure Tool (
 ). To do this, activate the measure tool and hover your
mouse pointer on the helideck as shown in Figure 9 below. For this model the helideck is at 35.4 meters thus any contour showing vertical fluctuating velocity should be above this height.
). To do this, activate the measure tool and hover your
mouse pointer on the helideck as shown in Figure 9 below. For this model the helideck is at 35.4 meters thus any contour showing vertical fluctuating velocity should be above this height.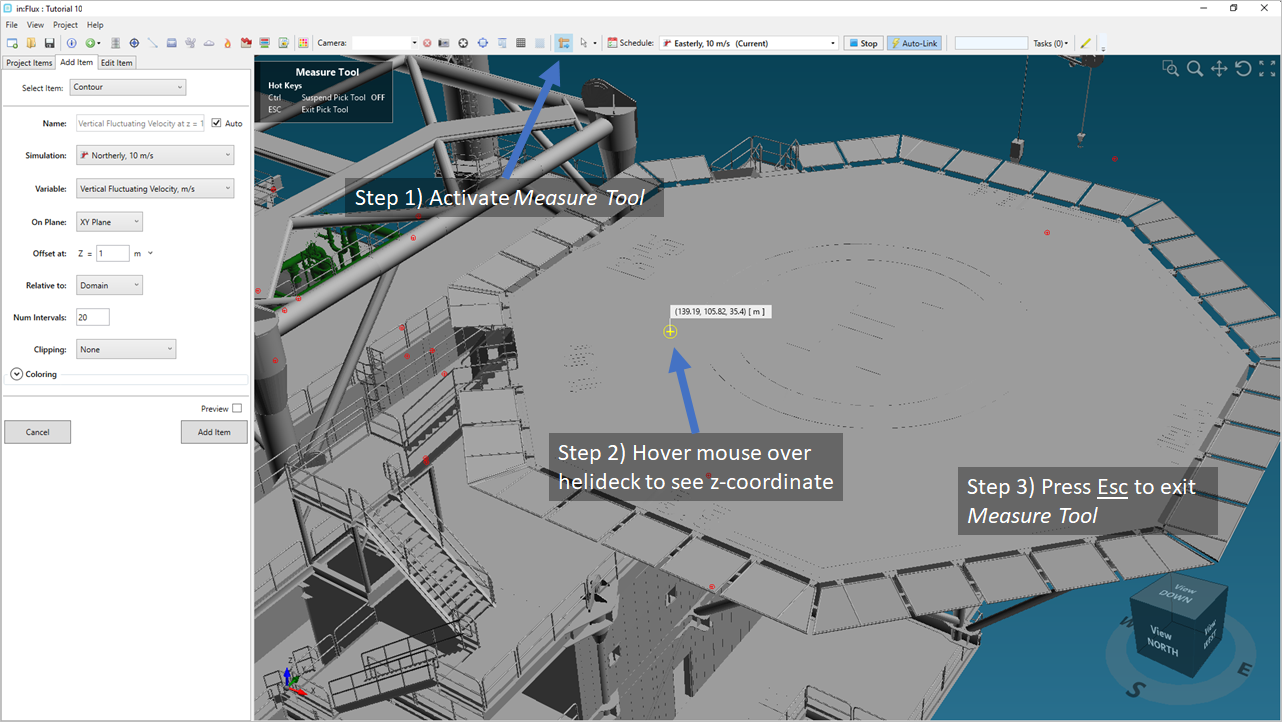
Tutorial 10 - Figure 9 - Process for quickly obtaining a coordinate from the CAD model, here the height of the helideck is needed
-
Set the Offset at Z = value of the contour plane to be "37 meters". This would place the contour 1.6 meters above the helideck.
-
Leave the Relative to: as Domain and Num Intervals to "20".
-
Click the Coloring arrow (
 ) to expand the section and move the Opacity slider left to a position
similar to the figure shown below. This will increase the transparency of the contour.
) to expand the section and move the Opacity slider left to a position
similar to the figure shown below. This will increase the transparency of the contour. -
Change the Range dropdown menu to User-Defined and two fields will appear. Set the Max value to be "1.75m/s" as shown in Figure 10 below
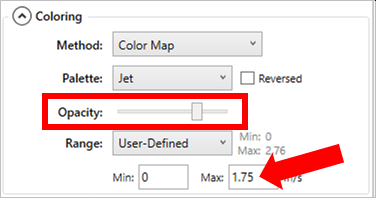
Tutorial 10 - Figure 10 - Approximate position for the opacity slider for the contour and showing the max value entered for the range (Step 9)
-
Click the Add Item button.
The Northerly, 10m/s vertical fluctuating velocity contour has now been added to the project, your screen should be similar to the figure below. As there some orange and red regions, this can and maybe some lower wind speeds should be further investigated as vertical velocity fluctuations above 1.5m/s are present.
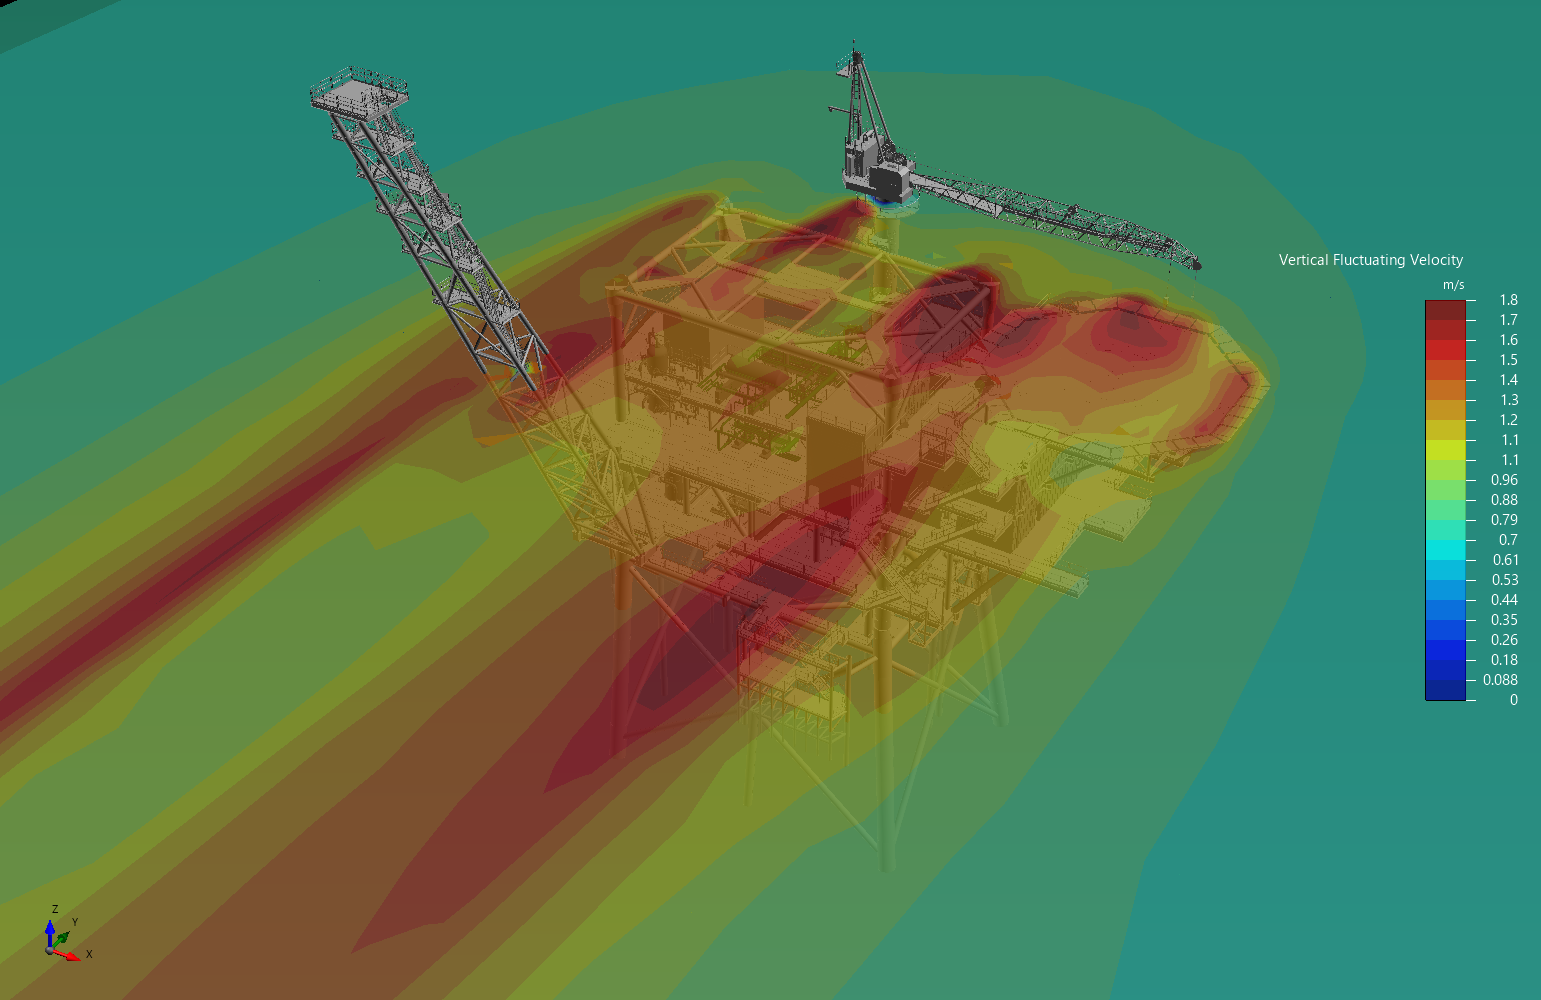
Tutorial 10 - Figure 11 - Defined contour shown vertical velocity fluctuations above the helideck for Northerly, 10m/s case
Change the contour's Simulation to North-Westerly, 15m/s. The updated contour (Figure 12) shows more red and orange coloring which indicates higher values of vertical fluctuating velocities near or above 1.75m/s. This is most likely because of the crane position. This case should then to be examined further for CAP 437 studies.
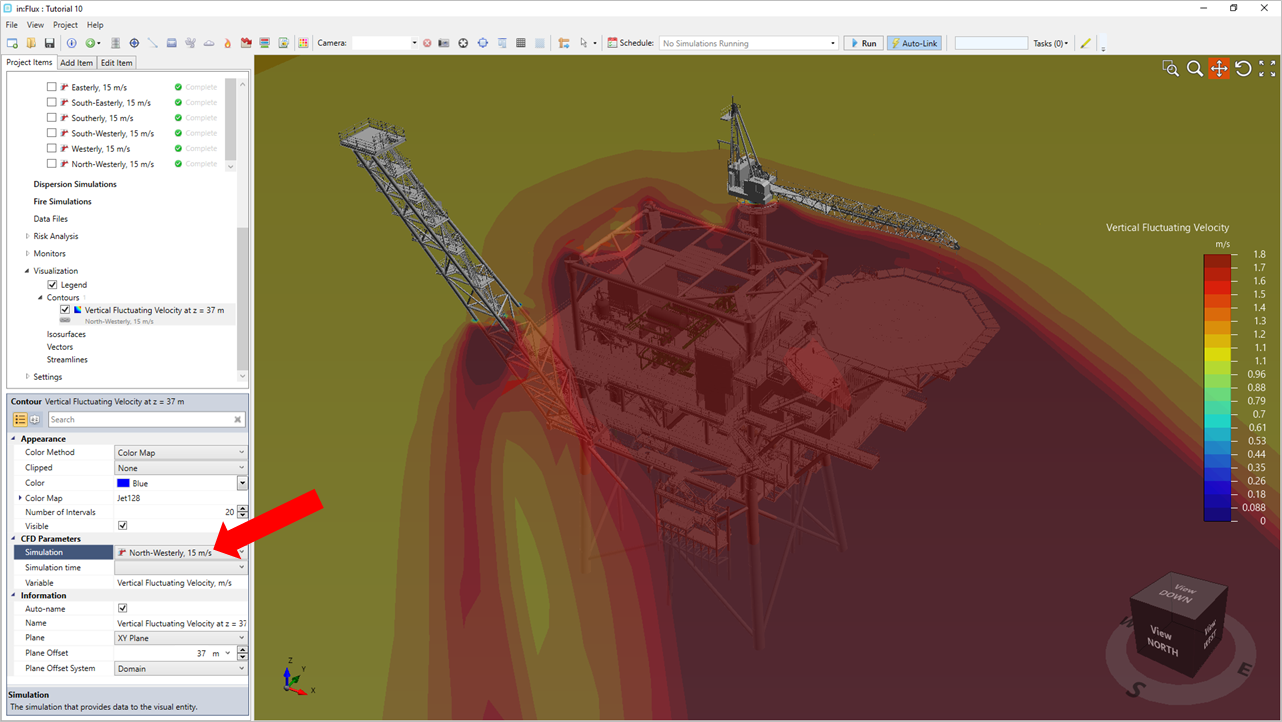
Tutorial 10 - Figure 12 - Vertical Velocity Fluctuations contour for the Northerly, 15m/s wind case
As it becomes tedious to change the contour for each of the 16 cases, the next section will use the batch image output capability to produce a series of 16 images (one for each ventilation case) to facilitate comparing the results.