Using Batch Image Output to Compare Results
The Batch Image Output is useful when comparing the same one or two visualizations for a series of dispersion or ventilation cases.
This section will create 16 images (one for each simulation) comparing the vertical fluctuating velocity contour at 37m height:
-
Position the 3D window in a way which will be easy to see results from each of the 16 cases. A Top view may be most beneficial.
-
Select the Batch Image Icon (
 ) from the toolbar or the Project menu.
 -
In the window that appears, click the folder icon in the upper right corner (
 ) and choose an output folder location
 -
You may enter a prefix or suffix to the names of the exported images or simply leave them blank
-
Select the Visual that has been defined in the last section - Vertical Fluctuating Velocity at z=37 meters
-
For the Simulations ensure that the All checkbox is selected to choose all 16 cases
-
Check that your window is similar to Figure 13 below and click the Output button
 If there is a warning stating that no
prefix or suffice was entered, press Yes
If there is a warning stating that no
prefix or suffice was entered, press Yes
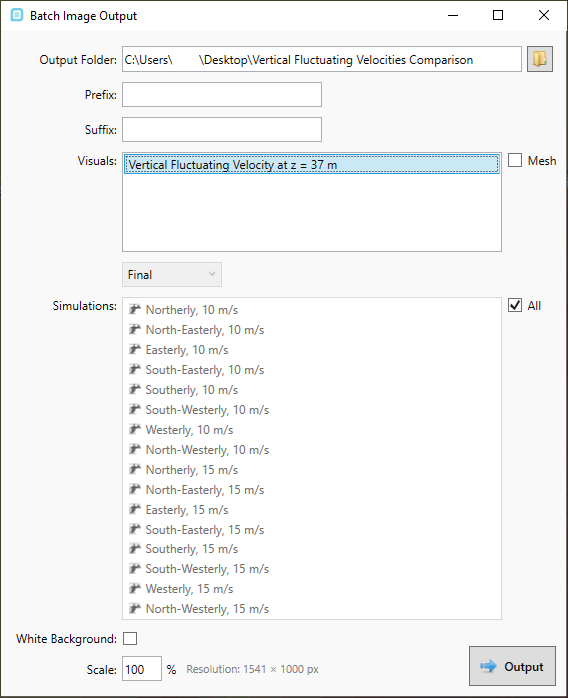
Tutorial 10 - Figure 13 - Batch Image Output window
in:Flux will then switch the contour to each of the 16 simulations in the project. When each contour is displayed, a screenshot of the 3D window will automatically be saved to the chosen directory. A small splash window will appear showing the progress.
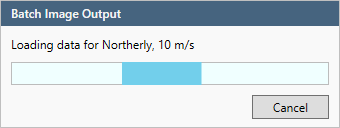
Tutorial 10 - Figure 14 - Batch Image Output processing window
The exported images will be labeled according to the name of the simulation.
Once finished, the chosen folder directory will now have 16 PNG files corresponding to each of the ventilation cases. Figure 15 below shows the images saved to the directory. For most cases, the 15m/s wind speed contains considerable regions with vertical fluctuating velocities higher than 1.75m/s. The batch image tool is useful to get initial ideas of where to focus further reviews, each case should still be investigated individually for project work.
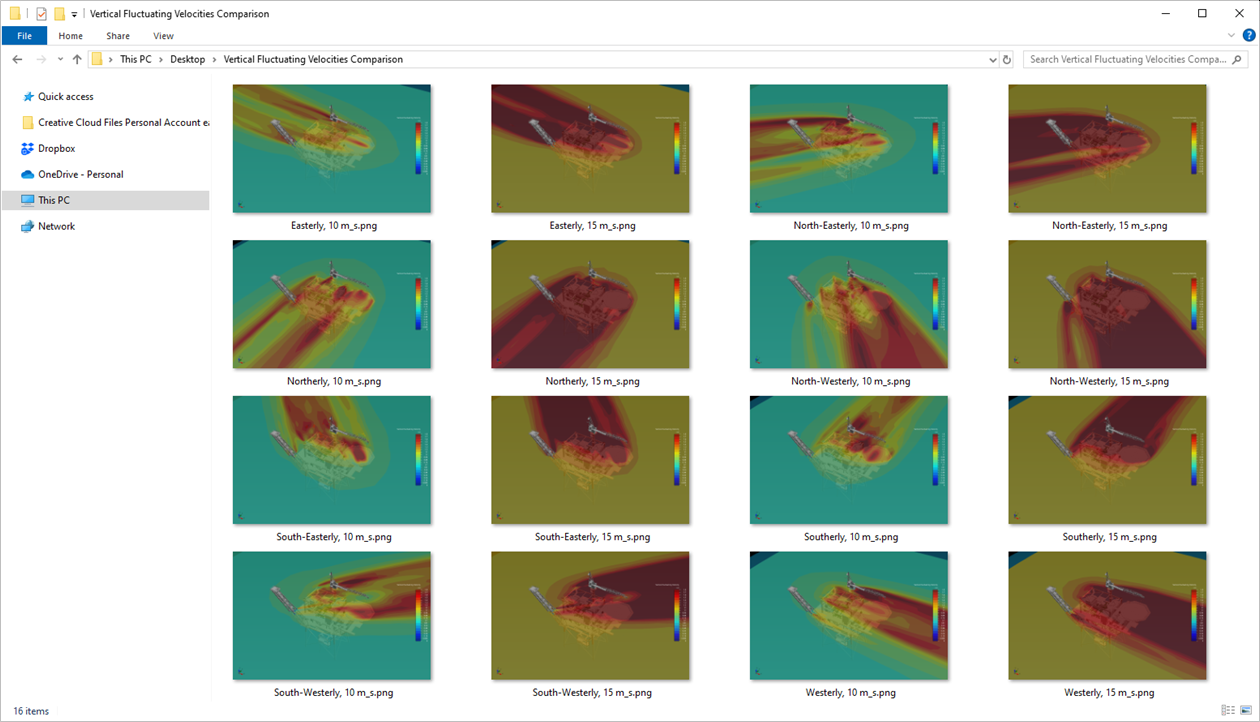
Tutorial 10 - Figure 15 - screenshot of output folder for the batch image capability
The Batch Image Output capability can be used with any visualization of in:Flux including vectors, streamlines, isosurfaces and vertical contours.
The next section will add an isosurface of the vertical velocity fluctuations which for some cases can provide a better representation of regions having values higher than 1.75m/s.