Review Results for Risk Based Analysis
With the consequence, and thus risk, applied to each simulation, a risk contour can be added.
Toggle on the visibility of the contour with a Frequency data type. From the properties panel, change the Data Type to Risk as shown in the figure below.
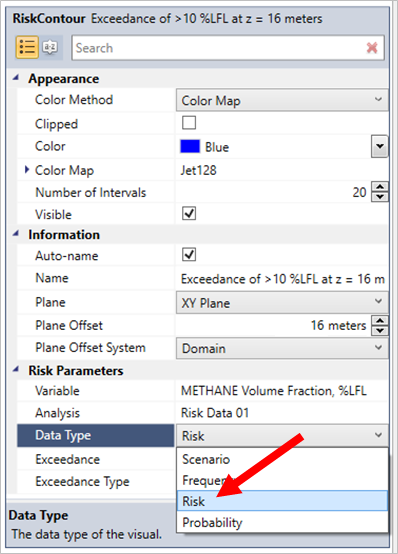
Tutorial 11 - Figure 33 - Changing the risk contour to have a Risk data type
This will now set the exceedance contour to display the risk of gas above 10%LFL. The legend will also have been updated to the ranges corresponding to the calculated risk, indicated by the light blue arrow in the figure below.
The range was automatically changed as the Value Range option in the Color Map section of the contour is set the Variable Min-Max (indicated with red arrow below). This is because the maximum and minimum values of the frequency contour were automatically chosen. When switching to the risk data type the values where automatically updated for the risk data.
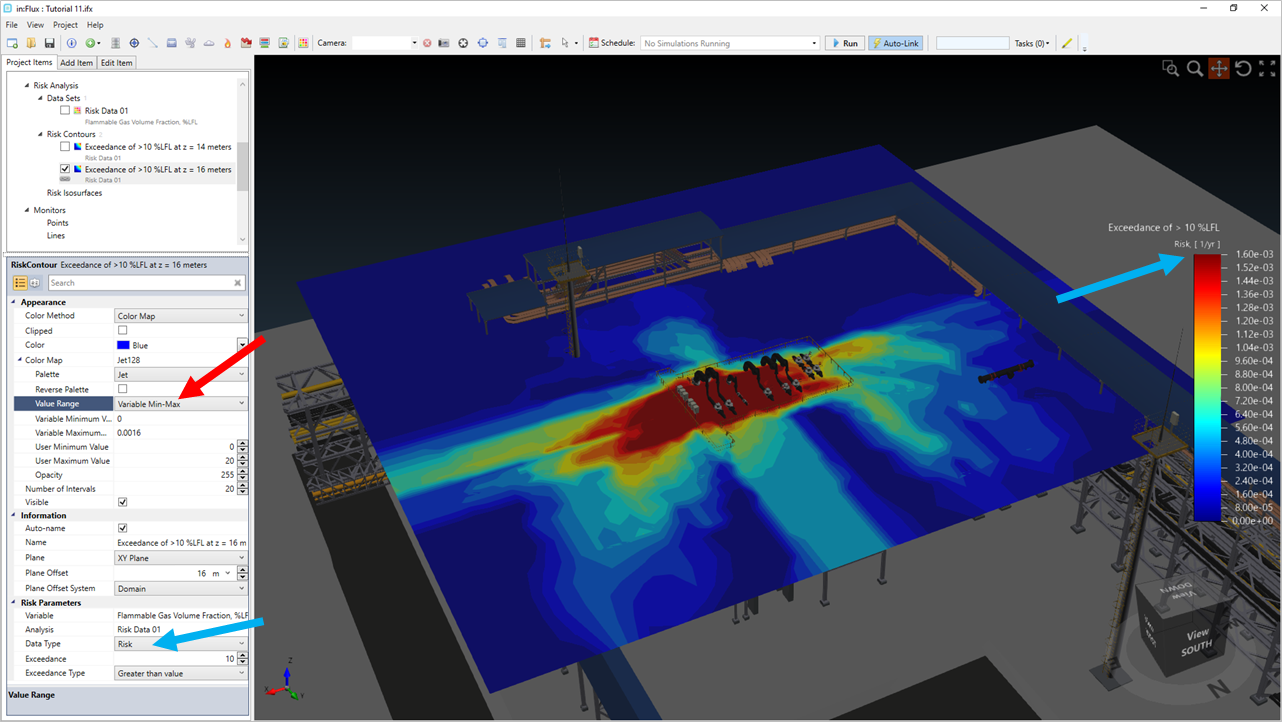
Tutorial 11 - Figure 34 - Risk contour showing exceedance of 10%LFL
As of version 2.11 of in:Flux, in addition to risk contours showing exceedance values, a 3D isosurface of a chosen risk value may be defined. These risk isosurfaces will have the same options as the risk contours but will require a single value to be chosen to display.
To add a Risk Isosurface, choose it from the Select Item dropdown menu in the Add Items Tab:
-
Enter a Name for the isosurface or use the automatically defined one.
-
Select the Risk Data Set defined earlier as the Risk Data
-
Choose a Data Type to display. For the below figure, Risk was chosen.
-
Enter an Exceedance value of 10 %LFL, the units will be based on the variable associated with the chosen risk data set.
-
Enter a Value to be displayed for the isosurface. As only one value for a variable can be displayed on a single isosurface it needs to be entered. For this risk-isosurface in the figure below a value of 1E-03 was entered.
-
Choose a Color for the isosurface and click the Add Item button
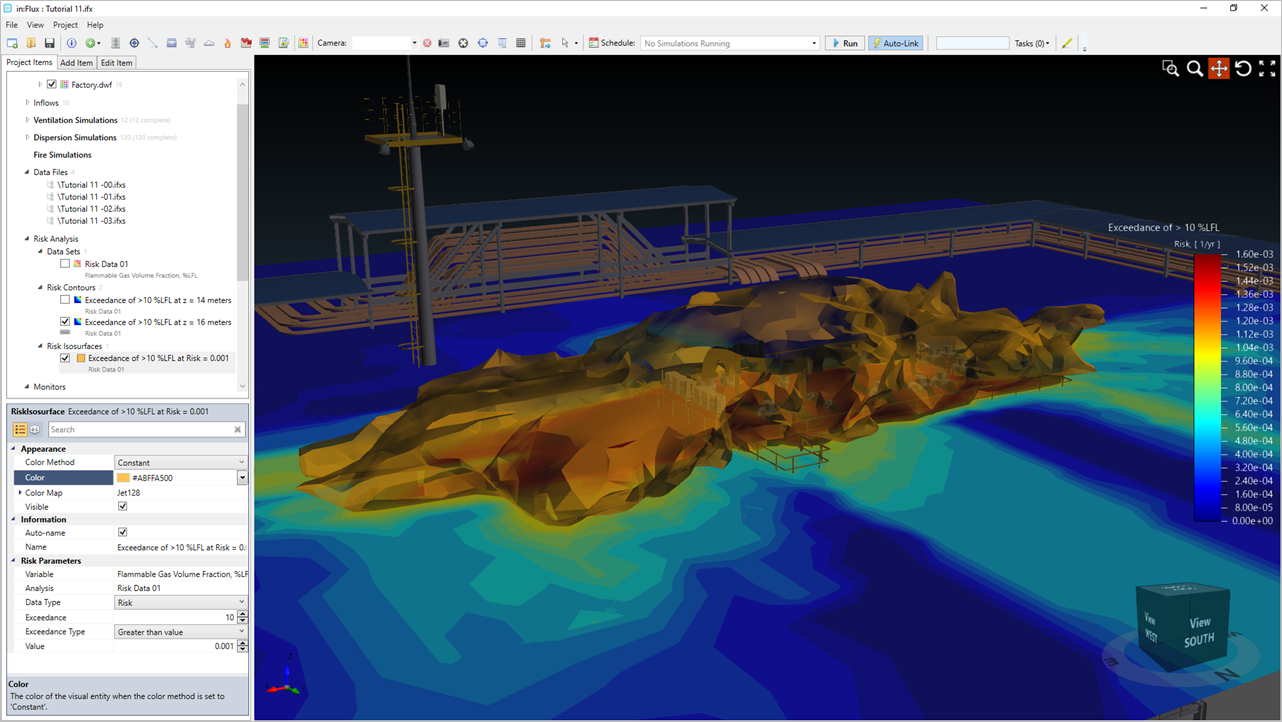
Tutorial 11 - Figure 35 - Risk Isosurface showing 3D view or region having exceedance of 10% LFL and 2E-03 risk
Continue to the next section to see how you can change the consequence weighting and instantly see the risk contours and isosurfaces updated.