Updating Risk Contours by Editing Consequence Weighting
There are many options available for the consequence assignment. The function can be modified depending on the requirements of the project. The consequence assignment is updated immediately upon confirming in the Consequence Weighting Window. This allows users to test various consequence functions quickly to see the effect of different function properties.
As this tutorial has already used a cube root function to assign the consequence for a combustible gas cloud, we will now change this to a linear scaling profile and add a step function.
The step function sets the consequence to zero for any value under the specified amount. For example, if for risk-based gas mapping you want to exclude combustible gas clouds smaller than 0.5m3, this can be done using the step function.
Follow the steps below to set a new consequence assignment to the project:
-
Right-Click Risk Data 01 and
 Consequence Weighting from the dropdown menu.
 -
Set the Method to Monitor Region Volume, and set the Region to Monitor Region 01
-
Choose the Volume (LFL-100%) as the Volume and select the Relative to Average as the Normalization
-
Now set the Scaling to Linear. The graph will update showing now a straight line instead of the previous cube root profile.
-
Click the Step Function checkbox and enter a Value of "7 m3". You will see that volumes of less that 7 along the x-axis are now set to zero.
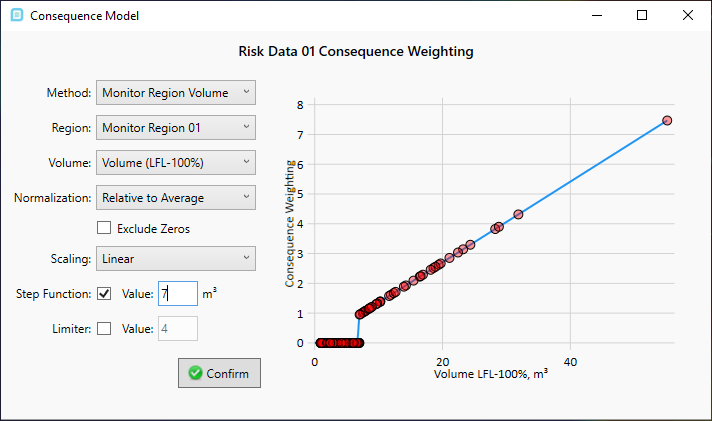
Tutorial 11 - Figure 36 - Consequence Weighting Window before confirming the consequence scheme set out in the steps above
-
Click the Confirm button
The risk contours and risk isosurfaces of the project will be automatically updated as the consequence values for the simulations have now changed. Toggle off the Risk Isosurface and look at the Risk Contour showing Exceedance of greater than 10%LFL at 16m. The below shows a comparison to the cube root consequence assignment to the linear consequence assignment with the step function. Notice how higher risk (red regions) is more contained to the platform and the contour coloring edges are more boxed and not smooth. The later is indicative of having less simulations included and thus less data present for displaying information.
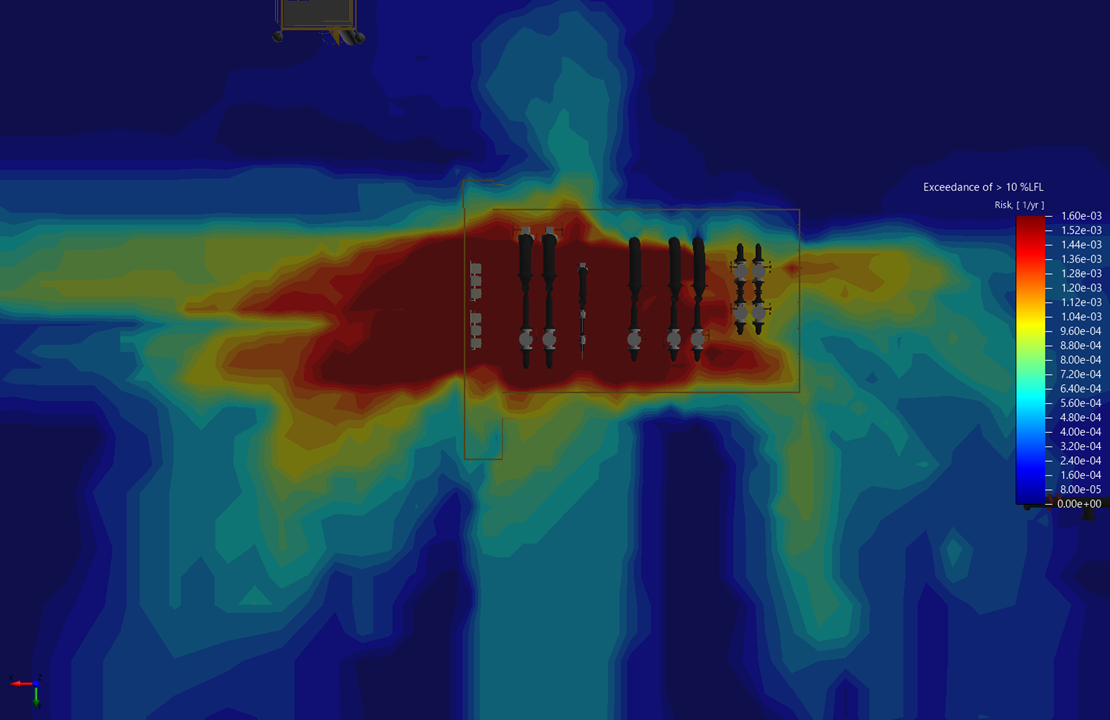
Tutorial 11 - Figure 37 - Risk Contour showing cube root consequence weighting
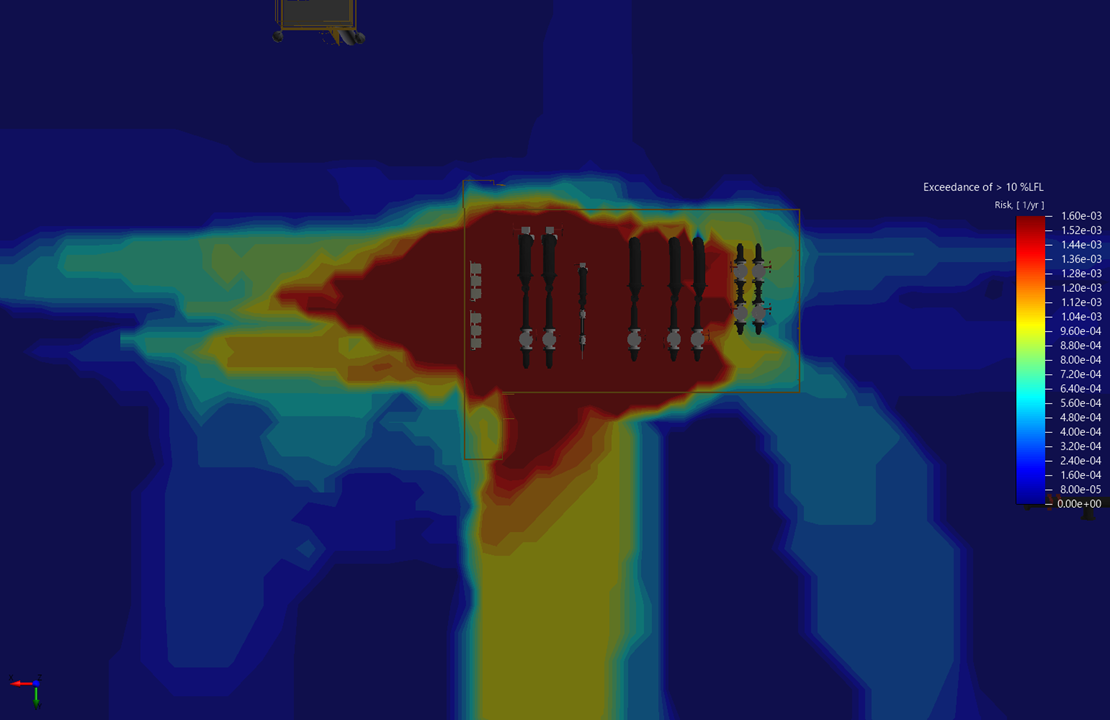
Tutorial 11 - Figure 38 - Risk Contour showing linear consequence weighting with step function excluding volumes under 7m3
Take some time to apply other consequence values with the Consequence Weighting Window. How to would you set this up for toxic gas instead of combustible? (hint, you assign a variable when you create a risk-data set).
Continue to the next section to look at exceedance curves for gas cloud volumes.