Optimizing Based on Scenarios
The first case of this tutorial will run an optimization based on the Scenarios simulated - Target Basis will be set to Scenario. Doing this tells the optimization algorithm that each dispersion case is weighted the same and no frequency or risk data will be used. Results will show coverage of scenarios detected.
The following steps will guide you through running a Scenario based optimization:
-
Open the Optimization Controller
-
In the upper-left corner of the window, set the Optimization Algorithm to Greedy Algorithm. The process for the Greedy Algorithm optimization is to find a detector in a region with the highest number of scenarios, the detected simulations are removed, and the process is repeated to find the next region with the highest density of scenarios. There are other options for the optimization algorithm which will be described later but for most all cases the Greedy Algorithm should be used.
-
As the monitor groups were defined earlier, they can be selected here rather than selecting each monitor individually. Click the dropdown menu next the Included Groups and uncheck the All checkbox and while pressing Ctrl click the Monitor Points and Monitor Lines groups as shown below. It is not mandatory to exclude the monitor region from the optimization; this step is added to show that individual or multiple groups can be chosen for optimization.
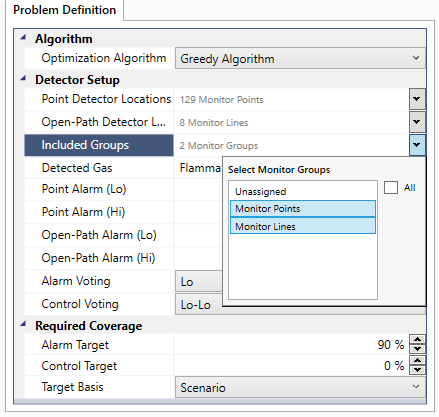
Tutorial 12 - Figure 12 - Selection of the two monitor groups used for the optimization
-
As the Risk Data Set 01 was defined looking at Flammable Gas, it will automatically appear as the Detected Gas, if you want to optimize for another gas or variable a new risk data set needs to be defined.
-
Enter the Point Alarm as "20 %LFL" and "60%LFL" for the Lo/Hi alarms, respectively.
-
Set the Open-Path Alarm as "1 LEL.m" and "2 LEL.m" for the Lo/Hi alarms, respectively
-
Set the Alarm Voting to Lo, and the Control Voting to Lo-Lo
-
Enter the Alarm Target as "80 %" and Control Target as "0 %"
-
Set the Target Basis to Scenario
-
Click Run
Since all the CFD dispersion cases have already been calculated, the optimization is quite fast and should take only a couple of seconds with the Greedy Algorithm. This result shows that 12 detectors were used to create a layout with 75% coverage of
the 120 CFD cases simulated. This is below our coverage target, indicated by the ![]() icon next to the Gas Detector Layout 01 coverage result.
icon next to the Gas Detector Layout 01 coverage result.
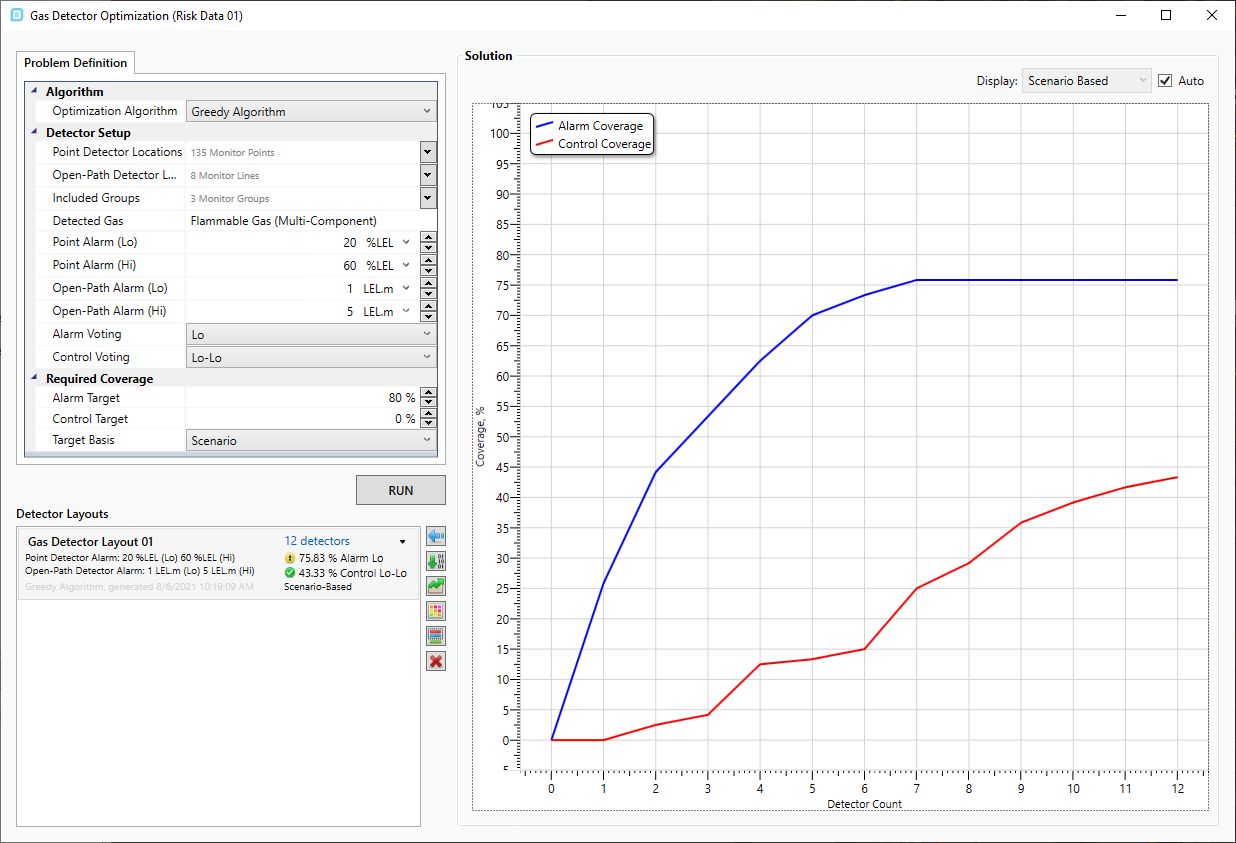
Tutorial 12 - Figure 13 - Optimized Layout for 20%LFL alarm for point gas detectors and 5 LEL.m alarm for open path
Clicking on the Gas Detector Layout 01 text in the Optimization Controller, will update the 3D window display the 12 monitors that were used to achieve the 75% scenario coverage result.
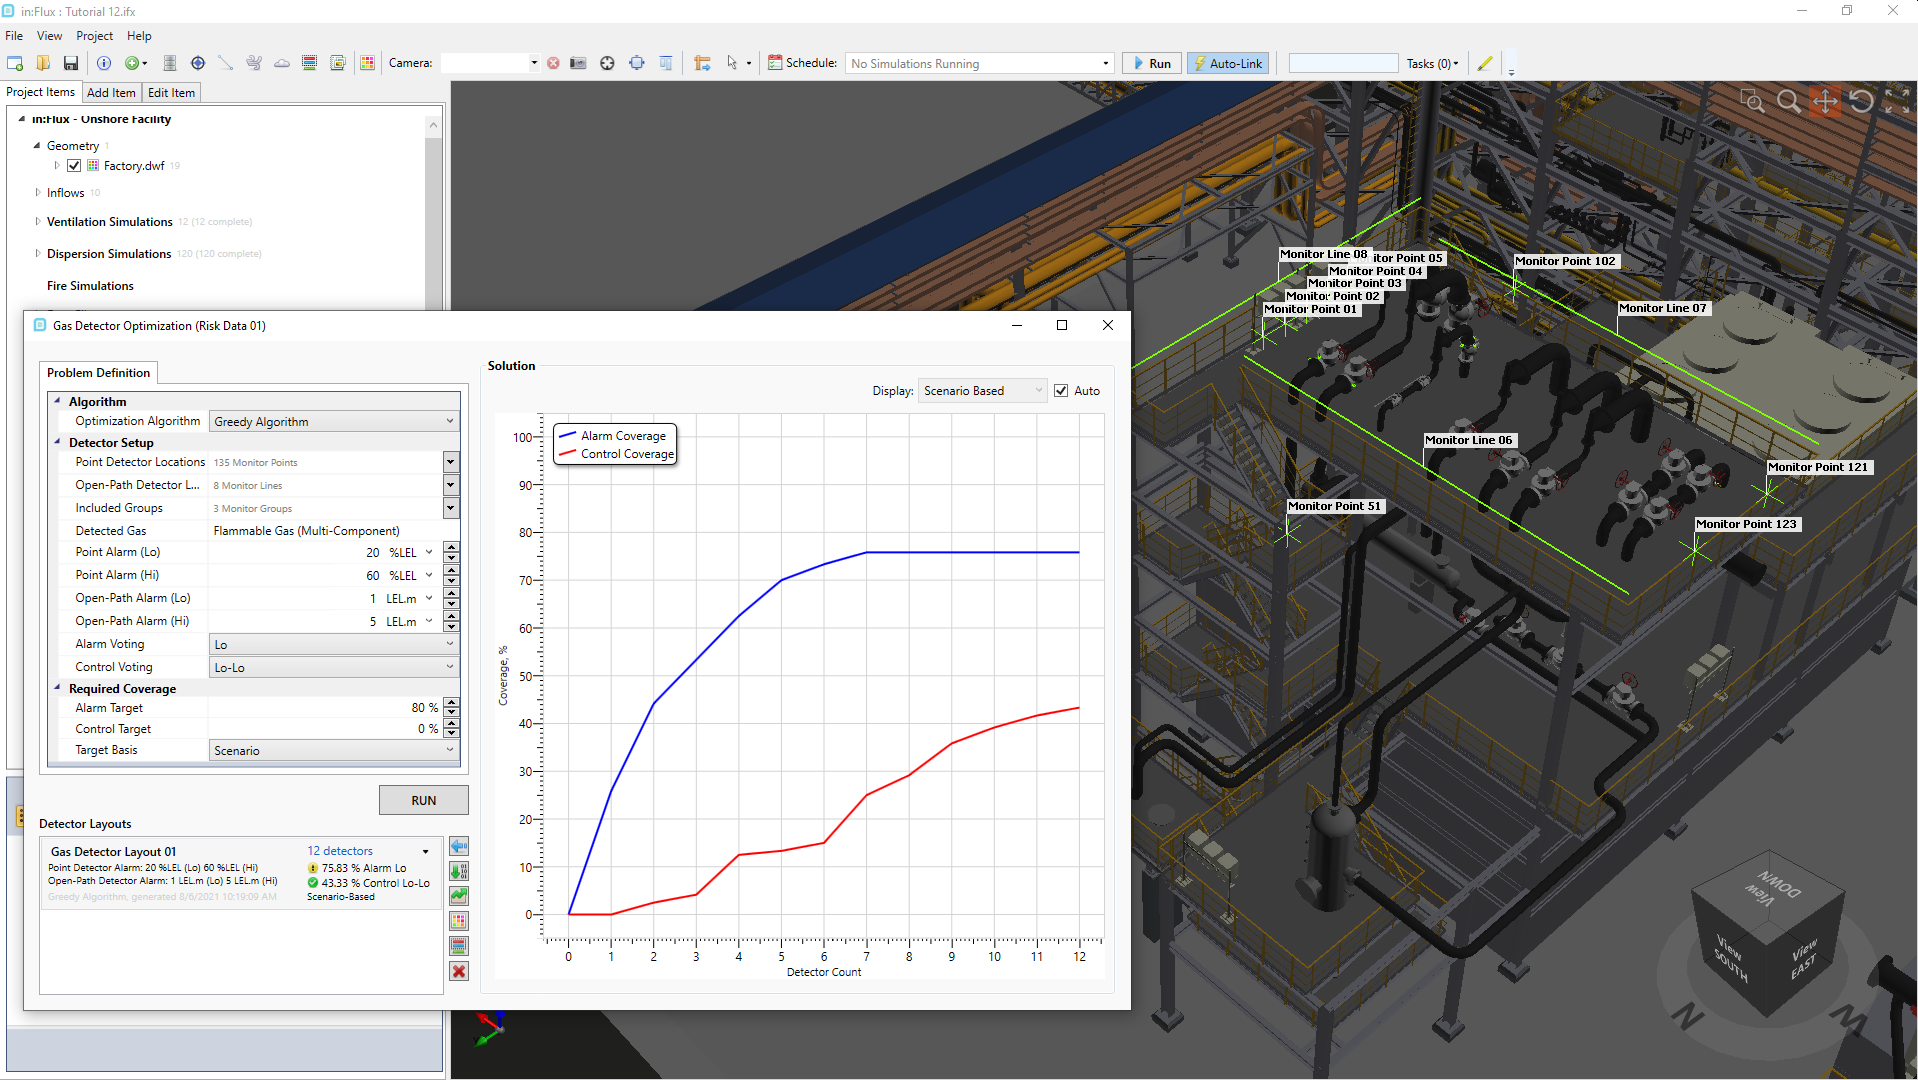
Tutorial 12 - Figure 14 - Selecting the layout will display the monitors used in the 3D window
Since the coverage target was not achieved either the alarm target can be lowered, the point alarm level can be lowered or more monitor points may be added. For example purposes, run a second optimization, this time lowering the alarm settings of the devices:
-
In the optimization controller, change the Point Alarm (Lo) to "10 %LFL"
-
Leave the 1ooN Target as 80% and the Target Basis as Scenario
-
Click Run
Here we see that for the second generated layout only 7 detectors were needed and the 80% coverage target was achieved. The lower detector count can be expected from lowering the alarm setting as it takes less gas at the LEL concentration to set the detector into alarm.
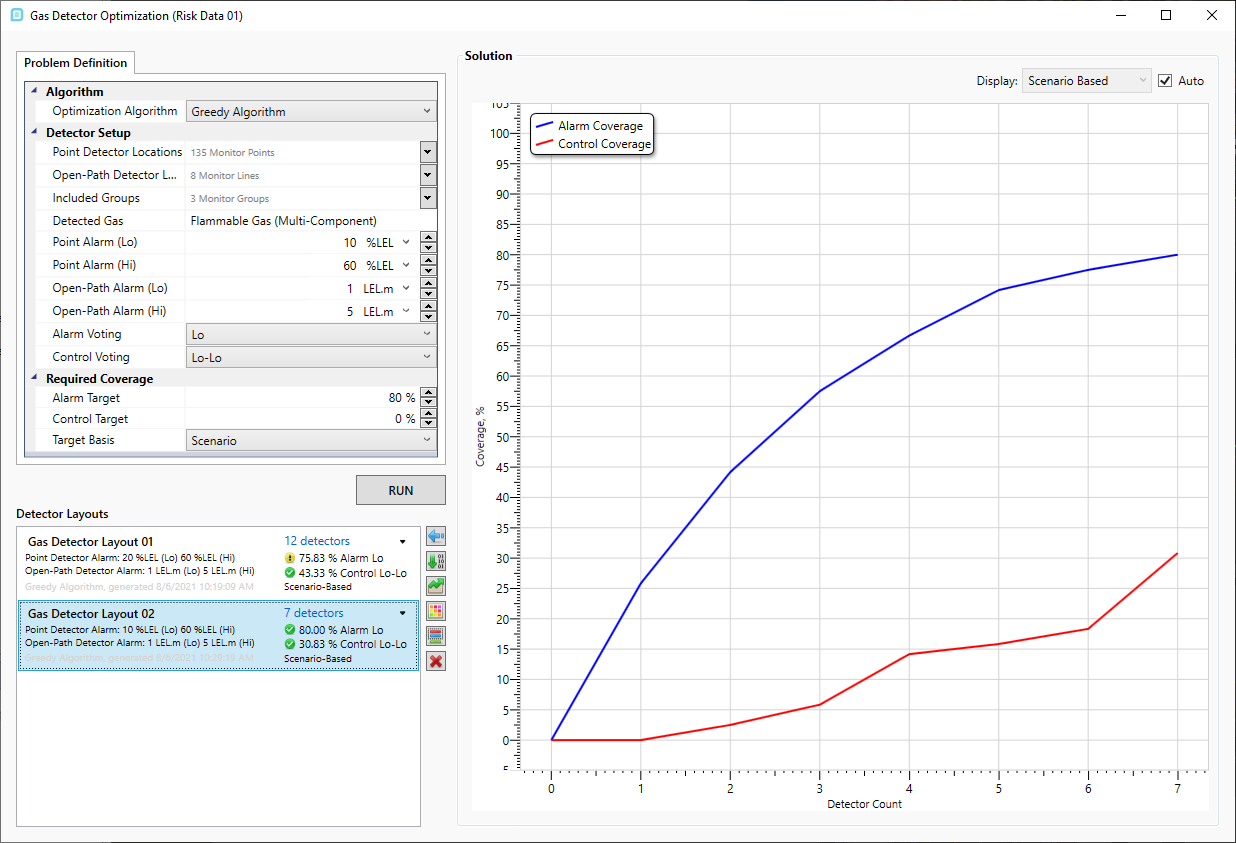
Tutorial 12 - Figure 15 - Running the optimization with lower alarm settings increases the scenario coverage
Click the small down arrow next the "7 detectors" text. This will display the order of precedence of the 7 devices used. For Gas Detector Layout 02, Monitor Line 08 and Monitor Line 07 are listed first meaning these two devices are detecting a large position of the scenarios simulated. This list of detectors directly relates to the x-axis of the solution graph. Figure 15 shows that about 45% 1ooN scenario coverage is achieved with the just these two devices alone.
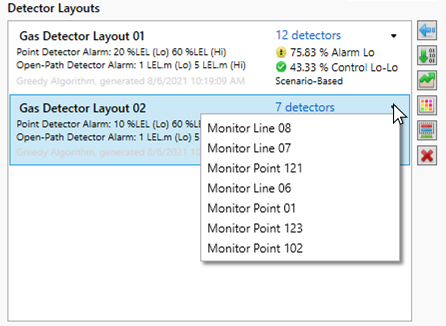
Tutorial 12 - Figure 16 - Showing the list of monitors used by precedence for the selected layout
The other post-processing and export options will be discussed in the last section of this tutorial.
Continue on to perform an optimization looking at the frequency and risk of the simulated cases.