Creating a new Risk Data Set from Optimized Layout
It is a power image to be able to show the unmitigated risk of a facility and then the updated contour showing the effect of the optimized layout. Additionally, this process can be used if your gas detector layout did not achieve the coverage target you entered as undetected leaks will be displayed showing where additional gas detectors might be needed in the project. This section will only go over the prior of showing a before/after picture of the risk contour with and without gas detection.
Follow the steps below to generate a new risk data set from the optimized layout:
-
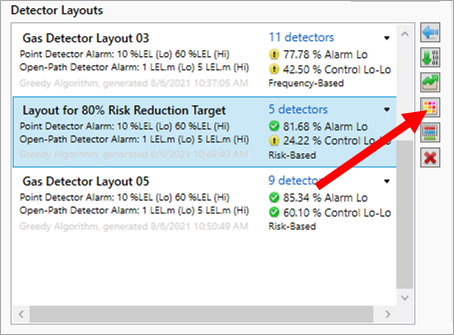
Open the optimization controller and select the Gas Detector Layout 04
-
Names of the Layouts can be changed by clicking on them and typing the revised name. Entering the coverage targets or monitor groups used can be helpful to organize layouts. Click on the Gas Detector Layout 04 text and change the name to "Layout for 80% Risk Reduction Target"
-
In the middle of the optimization controller, click the Create New Risk Data button shown below.
Tutorial 12 - Figure 24 - indication of where to define a new risk data set from a selected optimized layout
-
A new Risk Data Set called "Risk Data 01 (after Layout for 80% Risk Reduction Target)" will be added to the project items tab in the main in:Flux window. This data set will contain all the simulations which were not detected by the gas detector layout.
-
Close the optimization controller and from the Add Items tab add a Risk Contour
-
In the Risk Data dropdown menu select Risk Data 01 (after Layout for 80% Risk Reduction Target)
-
Set the Data Type to Risk
-
Enter an Exceedance of "10% LFL"
-
Choose and XY Plane with an Offset of 16 meters
-
Click the Add Item button
Link the legend to the resulting contour, your screen should be similar to Figure 25 below. This is mitigated risk contour (after applying gas detection) however the scale of the legend will be different than what it was for the unmitigated risk contour defined earlier. Follow the steps below to resolve the scaling difference.
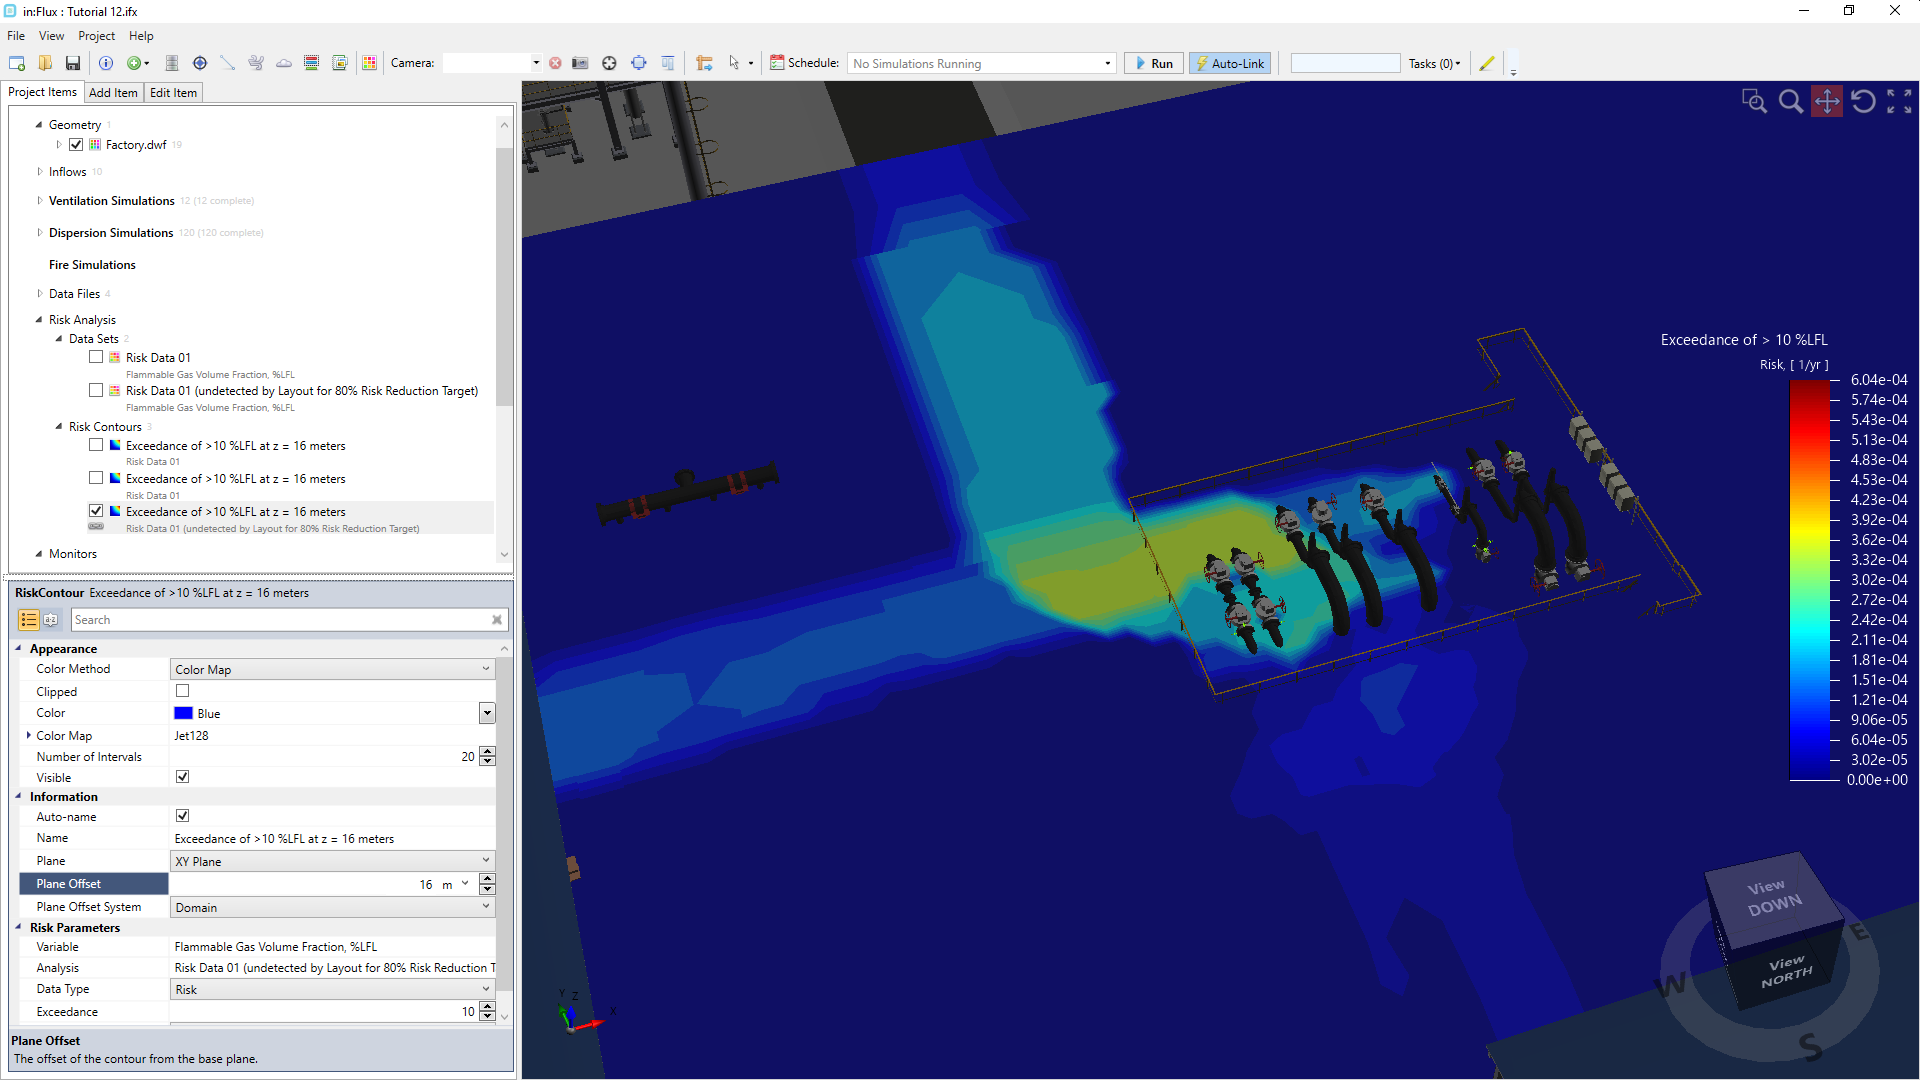
Tutorial 12 - Figure 25 - Resulting risk contour after detected simulations have been removed.
Below shows a comparison of the unmitigated vs mitigated risk contours which provides a powerful visual showing the affect of the gas detectors. To make these images, the scale (legend) of the mitigated risk contour (Figure 25 image) will need to be changed to match the scale of the earlier (unmitigated) contour.
-
Open the properties panel of the unmitigated risk contour. Expand the Color Map section and note down the value listed in the Variable Maximum Value text box.
-
Now open the Color Map in the newly generated mitigated risk contour. Change the Value Range to be User-Defined and enter the maximum range from the unmitigated contour (0.003646 in this case) as the User Maximum Value. This will set the scale/range of the mitigated contour to match the unmitigated contour.
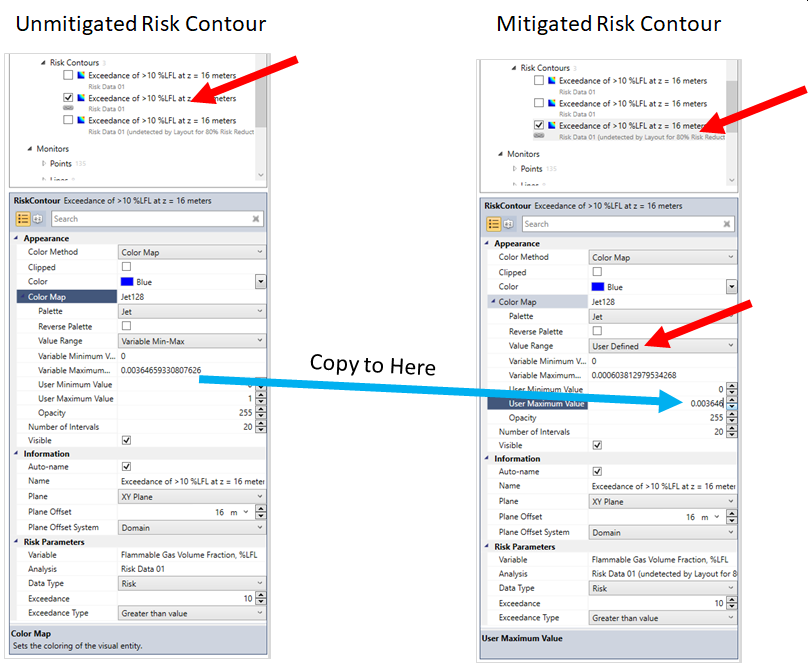
Tutorial 12 - Figure 26 - Process for manually changing a contour's range to match that of another which is useful in showing before/after images of gas detection effectiveness
The below shows the comparison of the Unmitigated and Mitigated Risk Contours after matching the scale as described in Figure 26.
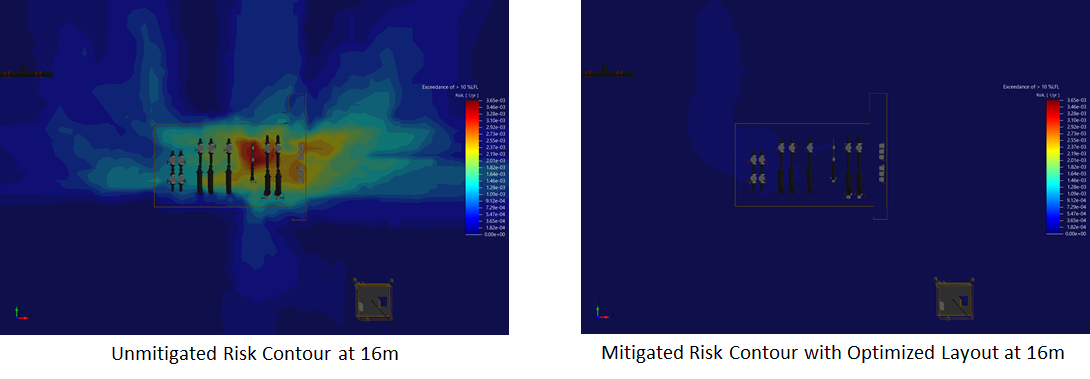
Tutorial 12 - Figure 27 - Comparison of unmitigated risk contours to risk contours with the optimized layout added
This completes Tutorial 12. You should now understand how to run gas detector optimization using scenario, frequency and risk methods.
If you have any questions regarding risk-based gas mapping please contact us at info@insightnumerics.com