Exporting Results
All layouts generated in the optimization controller are saved to the Risk Data Set in which the optimization was run on. If the Risk Data Set is deleted, then so will the optimization data.
There are three export options from the optimization controller:
-
Export Layout - exports an excel of the detector coordinates, a Detect3D (.d3d) file, or DWG CAD file of the optimized layout
-
View and export the Detection Matrix - a table of every case simulated and indication for which detectors went into alarm for the selected layout
-
Export Coverage Data - exports an excel file showing the order of devices used, coverage data points and graph of the coverage achieved
Export the layout and associated coverage for Gas Detector Layout 04:
-
Open the optimization controller and right-click Gas Detector Layout 04
-
Select the Export Layout (
 ) option first, in the window that appears ensure that the Save as type is set to Excel Document (*.xlsx) and name the file
 -
Right-click Gas Detector Layout 04 and export the Coverage Data (
 )
)
Open the excel file generated from the Export Layout option. The tabs for the exported layout are shown below containing a cover page, a layout summary page and a listing of each of the point and open path devices with their coordinates in CSV format.
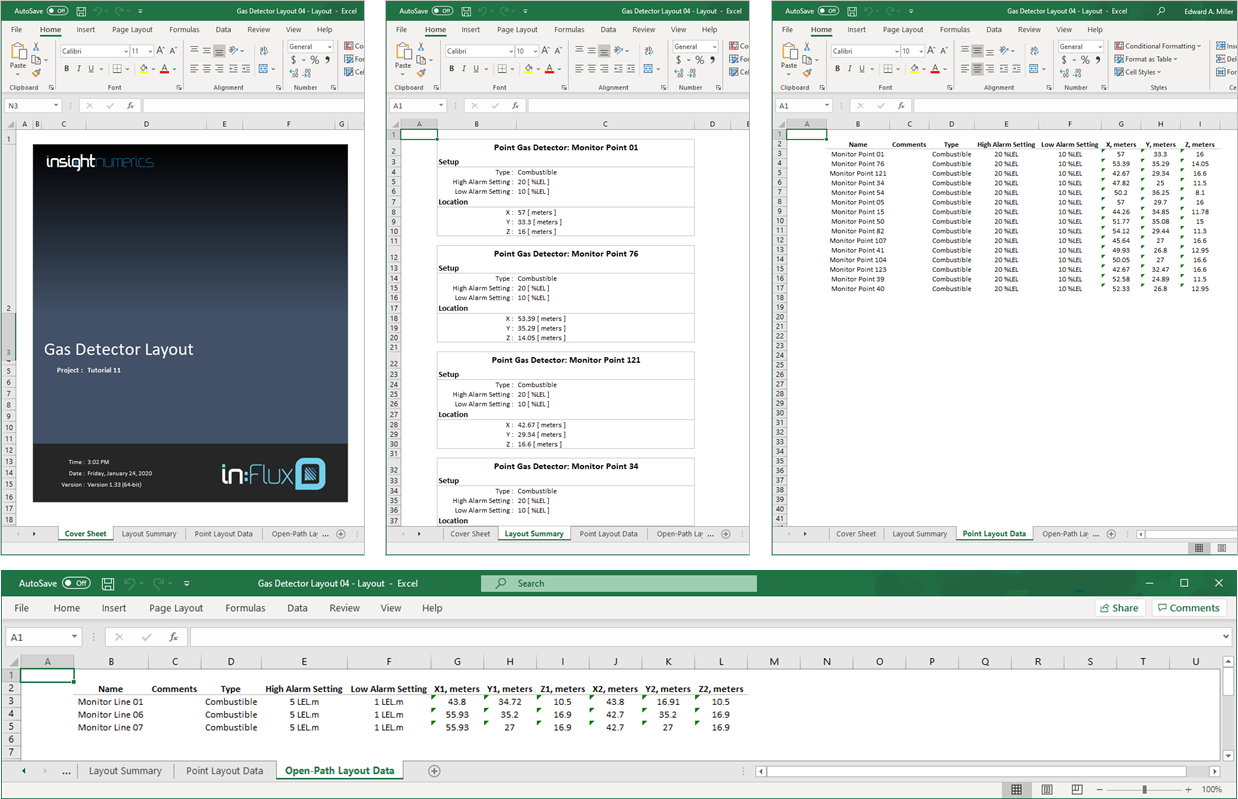
Tutorial 12 - Figure 20 - Excel export of optimized Gas Detector Layout 04
Open the Coverage Data excel file. This file provides the list of the devices used to achieve the coverage target in order or priority. The list also shows the contribution to 1ooN and 2ooN coverages along with the corresponding graph.
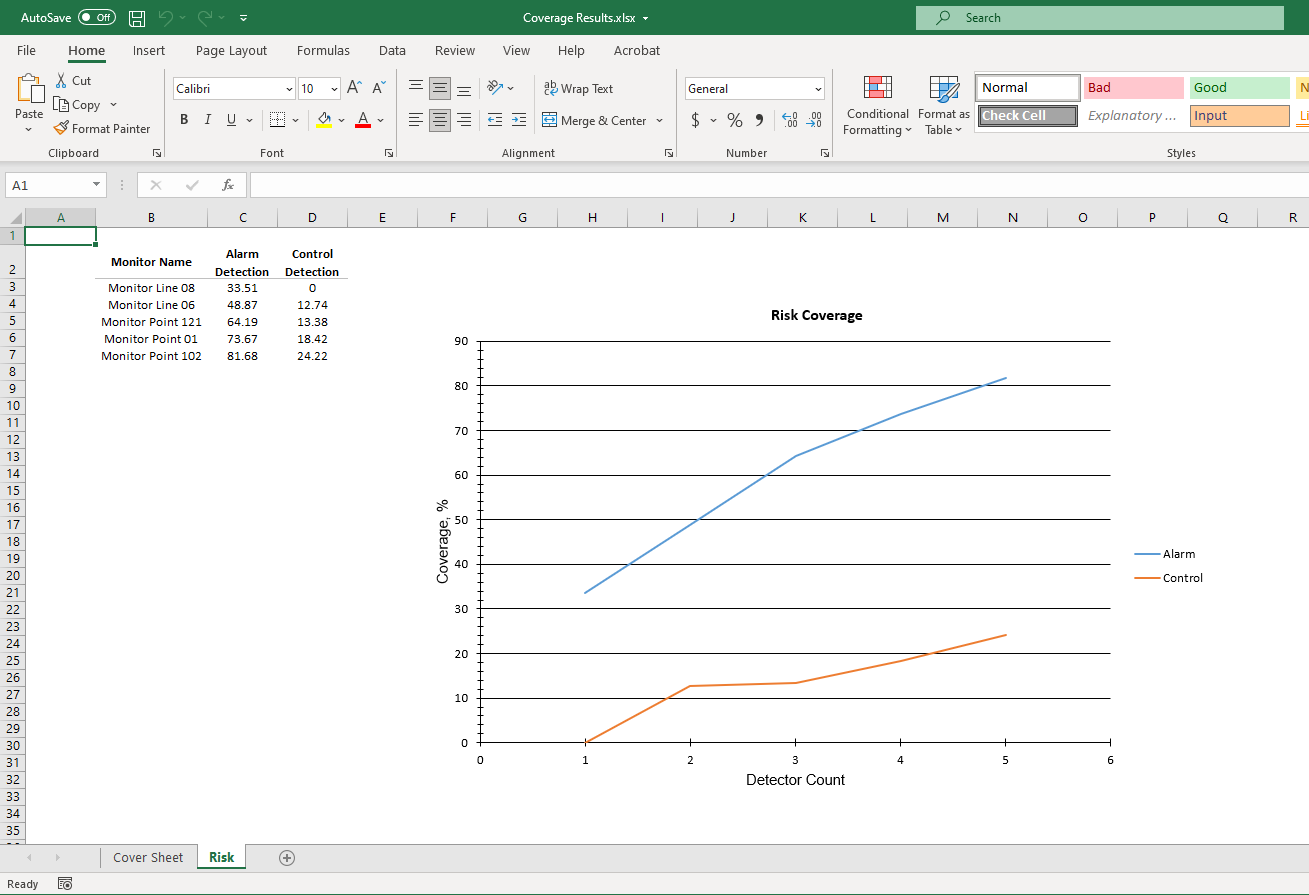
Tutorial 12 - Figure 21 - Exported coverage graph with listing of detectors used to achieve displayed coverages
Detect3D files may also be exported in Step 2 above, when setting the save directory choose .d3d as the file format, shown below. This allows for comparison of geographic gas mapping method with scenario, frequency and risk-based gas mapping methods.
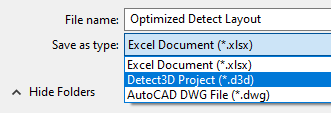
Tutorial 12 - Figure 22 - Exporting a detector layout to .d3d file
Lastly, open the Detection Matrix window( ). The window is populated with rows representing each case run and columns for each detector in the selected layout, as shown below. A symbol will be present in the cells to indicate which detector had an alarm and/or control trigger for the listed simulations. The o symbol is used for Alarm and the ⨂ symbol for control.
At the top of the window you can opt to have only a selection of the rows to be listed, as seen in the figure below. Available options are:
-
Show All Scenarios - will have rows for every simulation run in the table
-
Show Detected Only - only cases that were detected will appear in the table
-
Show Undetected Only - only cases NOT detected will appear in the table
-
Contribution Detection Only (Alarm) - showing cases which had an alarm trigger from detectors contributing to the coverage in the selected layout
-
Contribution Detection Only (Control) - showing cases which had a control trigger from detectors contributing to the coverage in the selected layout
-
Contribution Detection Only (Both) - showing cases which had both an alarm and a control trigger from detectors contributing to the coverage in the selected layout
Using the Export button in the upper-right corner of the window will export the current view of the Detection Matrix Window to Excel.
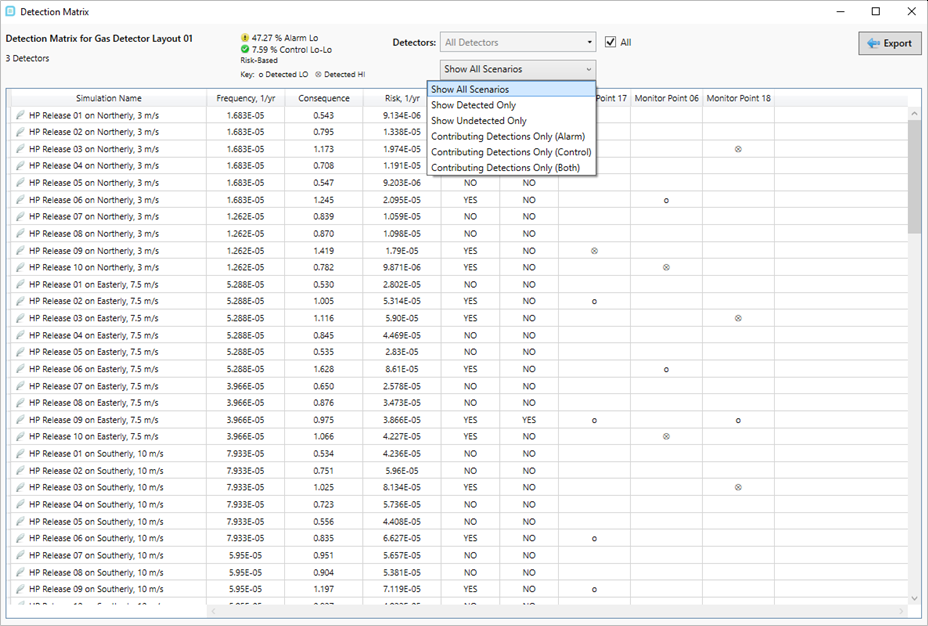
Tutorial 12 - Figure 23 - Detector Matrix Window showing which detectors detected which simulations
2D Plot Plan Layout
Alongside the exports above, the optimized layout can be viewed as a 2D plot plan: the 3D window is converted to a 2D orthographic view resembling an F&G system layout drawing, with detectors shown as symbols against a legend. This is a separate output from the DWG CAD file produced by Export Layout in Step 2 above. See 2D Layout View for what the view contains and how to export it — the feature is the same in both products, and the only difference is where it is opened from. In Detect3D it is available from the toolbar or Project menu at any time; in in:Flux it is available only from the optimization controller, once optimization has completed.
-
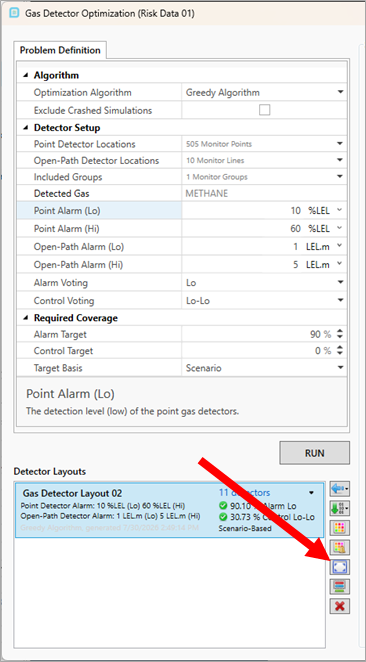
From the optimization controller, click the 2D Layout button
 , indicated below.
 -
Fill in the Drawing Manager project metadata (Project Name, Company, Description, and any additional title-block lines). Optionally tick Show Labels to tag each detector.
-
Export the view as an image in the same way as a screenshot.
Note that the plot plan is a 2D projection of a 3D arrangement — detectors at different elevations may overlap in plan view, so it should be read alongside elevation data where elevation matters. Detectors are symbolized by type; manufacturer-specific styling beyond the standard symbol set is not supported.
Continue to the next section to create before and after images comparing the unmitigated risk contour to the risk contour with the optimized layout.