Reviewing Results with the Batch Image Output
With five fire cases complete, you can edit an already defined visual, such as isosurfaces, to the newly completed cases. This can be done by right clicking the Isosurfaces text, selecting Set All to Simulation... and then choosing the simulation to have the isosurfaces show data for, as shown below.
This can become tedious when having several completed simulations that you want to compare. The Batch Image Output tool can help with this by exporting a single image file for each case in the project for a chosen visualization. Follow the steps below to use the tool for this project:
-
Position the 3D window to a good position that you would be able to see any result from the five cases. This is easier for this project as all the leaks are in the same location, for other projects you may want to zoom out to see most of the module or facility.

Tutorial 16 - Figure 04 - View of position of 3D window to be used for Batch Image Output
-
On the toolbar, click the Batch Image Output Icon (
 )
) -
Select an output folder for the image files to be saved
-
In the Visuals section, select the two radiation isosurfaces
-
In the Simulations section, uncheck the All checkbox and select each of the fire simulations.
-
Ensure your window appear like Figure 05 below and click Output
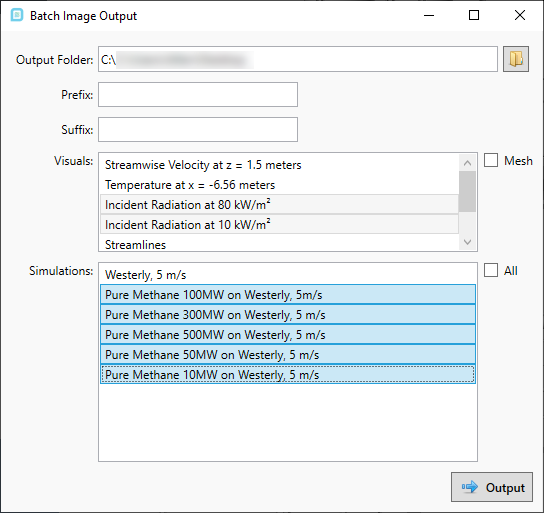
Tutorial 16 - Figure 05 - Batch Image Output window showing that the two radiation isosurfaces will be iterated over the five fire simulations
in:Flux will then apply the selected visuals to each of the selected simulations. A screenshot will be saved of the 3D window for each simulation.
When complete, open up the chosen output folder to view the results...
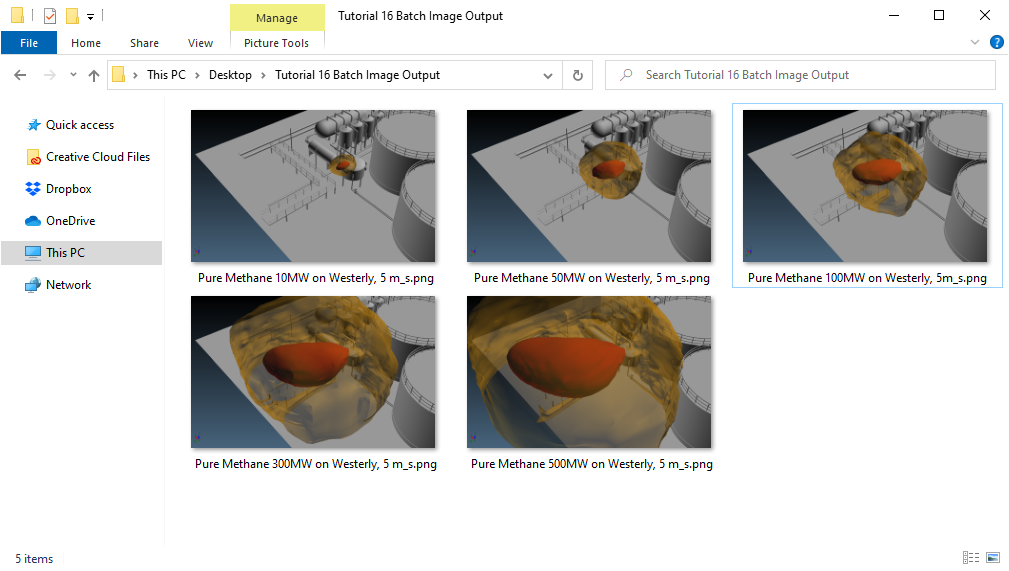
Tutorial 16 - Figure 06 - View of the images created from the Batch Image Output Tool
This capability is helpful when comparing several cases of the same variable or visualization. Continue to the next section to review the available monitor data.