Reviewing Transient Fire Modeling Monitor Results
Once complete, open the Monitor Point Data window and see that a Transient dropdown menu is now present. By default the transient cases will show their final value obtained while the stead state cases will show the results for the developed fire.
Change the Variable to Incident Radiation, kW/m2 and click the Plot button (![]() ). A new window will appear with text saying 'No Transient Data' this is because no cell in the Monitor Point Data window has been selected. Click on the cell corresponding to Monitor Point 07 and the Pure Methane 100MW - ESD@10s case, the transient graph should update and be similar to the figure below. Here it can be seen how the incident radiation increases at Monitor Point 7 until just after the shutdown is activated where it drops to near 0 kW/m2. Go through and click some other cells with transient data to view how the values change with time.
). A new window will appear with text saying 'No Transient Data' this is because no cell in the Monitor Point Data window has been selected. Click on the cell corresponding to Monitor Point 07 and the Pure Methane 100MW - ESD@10s case, the transient graph should update and be similar to the figure below. Here it can be seen how the incident radiation increases at Monitor Point 7 until just after the shutdown is activated where it drops to near 0 kW/m2. Go through and click some other cells with transient data to view how the values change with time.
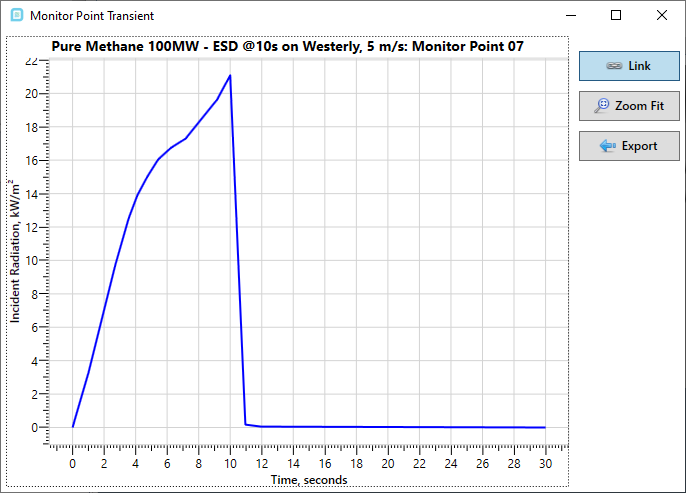
Tutorial 17 - Figure 06 - Graph of incident radiation vs time for the transient fire simulation with a shutdown at 10 second
Rather than the table in the Monitor Point Data window showing the Final result, change the Transient option to Max Value. The figure below then shows the maximum value obtained at each of the monitors for each case simulated.
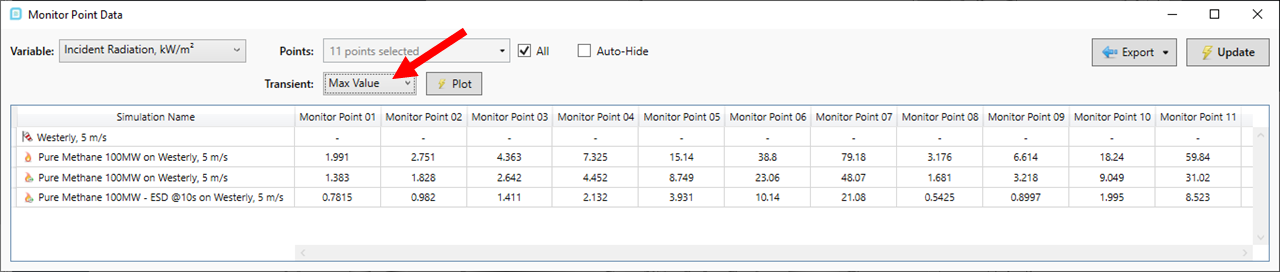
Tutorial 17 - Figure 07 - Monitor Point Data Table showing maximum value obtained at each monitor point
The transient graphs and monitor point data can be exported to excel for further analysis.
Continue to the next section to define visualizations for the transient fire cases.