Exceedance Contours and Isosurfaces for Risk Based Fire Projects
The remainder of the tutorial will use of the Tutorial 19.ifx (42MB) file.
Once the simulations are complete, move the now larger solver files back to the directory they were created, overwriting the original. If using the file above, this step is not necessary. A warning sign will be present next to the data files names but this can be ignored for this tutorial.
Risk Contours
This section will define a Scenario and a Frequency exceedance contour:
-
Select Risk Contour from the Add Items Tab
-
Leave the Name as its auto-defined one
-
Select the Risk Data to the one created in the previous section - Radiation Risk Data Set
-
Set the Data Type to Scenario. This will set the contour to display results based on the number of scenarios in each region with above the exceedance value.
-
Enter a value of Exceedance as "10 kW/m2"
-
Set the On Plane to XY and enter the Offset as "1 meter" and leave the Relative To option as Domain
-
Open the Coloring section and set the Range to be User Defined. Enter a value from "0" to "50" as the Min and Max values, respectively.
-
Click the Add Item button
-
From the Project Items Tab, right-click the contour and select Link to Legend
Here we see that of the 178 cases simulated there are several regions which have over 50 cases with over 10kW/m2 incident radiation (shown in red below). Change the User Maximum Value to 70 or 100 in the properties panel to see how the contour changes with the number of cases representing the red region.
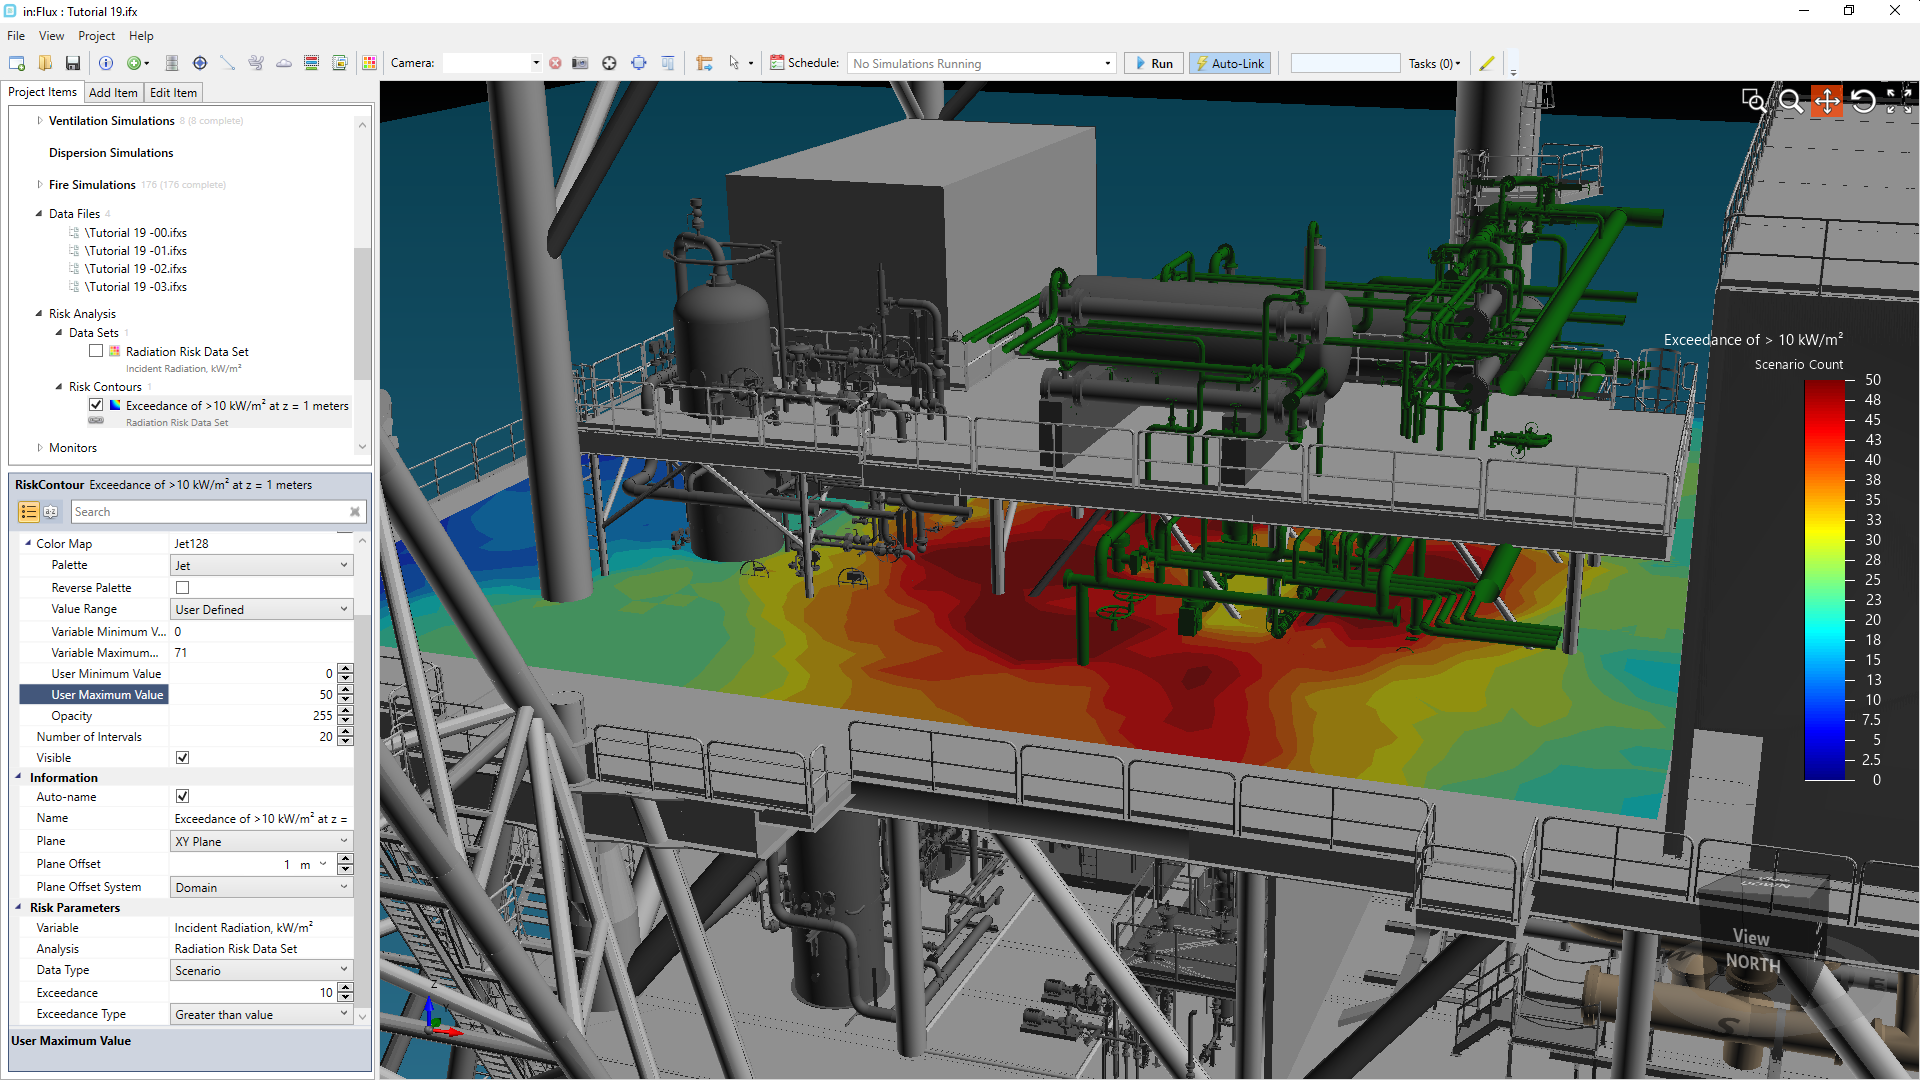
Tutorial 19 - Figure 20 - Added contour showing the regions where there are multiple cases with above 10kW/m2 incident radiation
As with other contours in in:Flux, once defined the contour can be moved to any plane at any height within the risk-data set. From the properties panel of the risk contour change the plane offset to 4.5m to raise the contour to the height of the other deck.
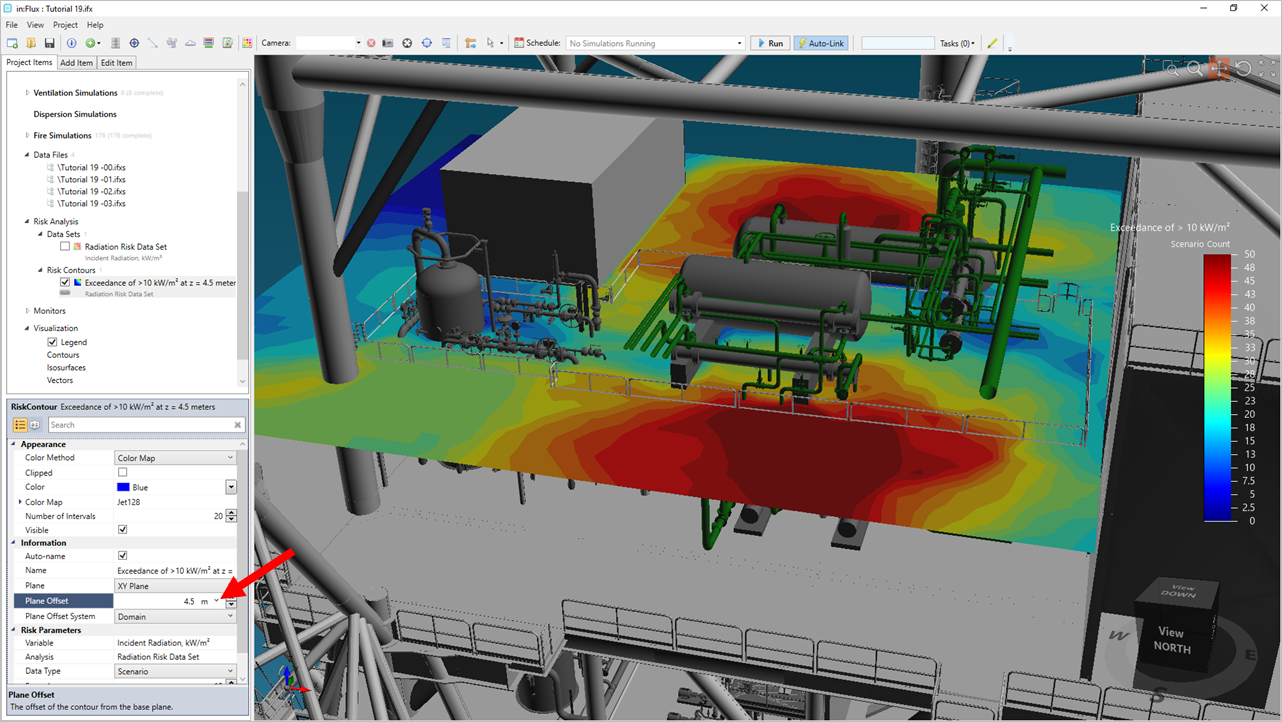
Tutorial 19 - Figure 21 - Exceedance Contour of radiation for this tutorial having been moved up to 4.5m height
As the above contour entered a User Defined range you may opt to change the Color Map options to set the Value Range to Variable and then change the Data Type of the contour to Frequency. Or you may follow the steps below to add a second risk contour to the project:
-
Select Risk Contour from the Add Items Tab
-
Leave the Name as its auto-defined one
-
Select the Risk Data to the one created in the previous section - Radiation Risk Data Set
-
Set the Data Type to Frequency
-
Enter a value of Exceedance as "10 kW/m2"
-
Set the On Plane to XY and enter the Offset as "4.5 meter" and leave the Relative To option as Domain
-
Open the Coloring section and set the Range to be Auto.
-
Click the Add Item button
-
Right-click the contour and link the legend to see which colors pertain to which frequency values
This frequency contour shown in Figure 22 is the frequency having an exceedance of 10kW/m2 incident radiation for the fire cases simulated. Red and orange regions will have a high frequency and blue regions have a low frequency, this can be changed via the palette option in the color map dropdown region.

Tutorial 19 - Figure 22 - Updated contour showing exceedance of LFL with a frequency basis
Risk Isosurface
As of version 2.11 of in:Flux, in addition to risk contours showing exceedance values, a 3D isosurface of a chosen risk value may be defined. These risk isosurfaces will have the same options as the risk contours but will require the user to select a value to be displayed (e.g. a value listed in the risk contour legend).
Choose Risk Isosurface from the Select Item option in the Add Item Tab:
-
Enter a Name for the isosurface or use the automatically defined one.
-
Select the Radiation Risk Data Set as the Risk Data
-
Set the Data Type as Risk.
-
Enter an Exceedance value of 10 kW/m2, the units will be based on the variable associated with the chosen risk data set.
-
Enter a Value to be displayed for the isosurface. As only one value for a variable can be displayed on a single isosurface it needs to be entered. The available range is provided next to the text box. For this risk-isosurface in the figure below a value of 1.3E-02 was entered, 0.013 is also a valid input.
-
Choose a Color for the isosurface and click the Add Item button
For the below figure, note that the isosurface is restricted by the height of the risk data set. To properly accomodate this isosurface you may consider re-defining and updating the risk data set to allow for the larger isosurface, or a smaller value/exceedance could be entered.

Tutorial 19 - Figure 23 - Risk Isosurface showing 3D view or region having exceedance of 10% LFL and 1.3E-02 risk
This concludes the risk-based fire simulation tutorial.
If you have any questions about the capabilities or methodologies applied, feel free to email us at info@insightnumerics.com