Distribution Comparison
The below images show a comparison of a good and a bad example of geometry distribution. Image 22 shows a "good" bounding box in green. The bounding box is tight to the area of interest in the fire and gas mapping project. Image 23 shows a bounding box which is much larger than the fire zone region, thus adding additional triangles to the simulation which may increase simulation time.
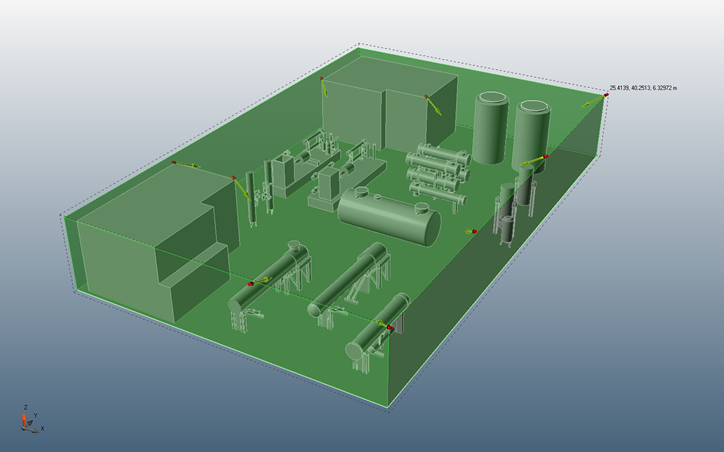
Image 22 - A Good bounding box shown above
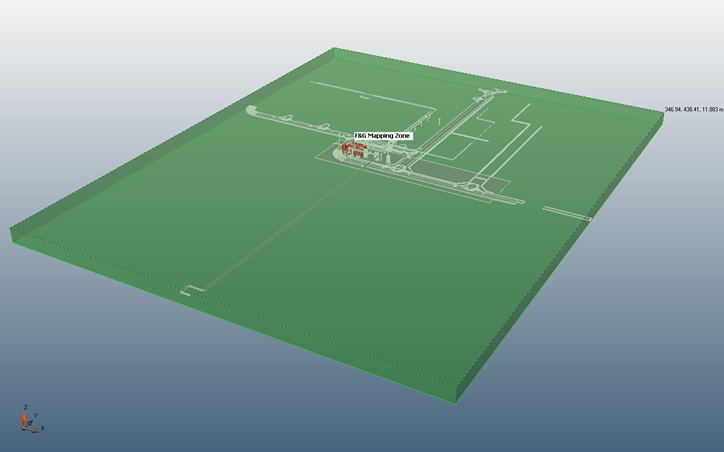
Image 23 - Conversely, irrelevant geometry greatly extends the bounding box (shown in green) far outside the area of interest (small red region in center of image).
The bounding box in Image 22 allows for much faster computation times. If editing the CAD in the original software is not possible, Detect3D contains a Crop Geometry Tool capability which will be described in the next section.