Gas Detector Coverage Calculation
This section describes how coverage for point and open path gas detectors using the geographic/volumetric gas mapping methodology is done. This method is used by several F&G mapping softwares, Detect3D included. There exist many variations and interpretations of the geographic method, the below goes over just a few key points, please consult your project's fire and gas performance methodology, the ISA TR84.00.07 or the British Standard BS60080:2020 for further guidance.
Background
The well referenced HSE OTO-93-002 report is the published results of experimental research done in 1992 by the UK HSE and Lloyd’s Register. The report looked to determine the size of gas cloud which would cause a damaging overpressure wave (exceeding 150mbar). The research presented in HSE OTO 93-002, formed the basis for the spherical gas cloud approach.
The document determined that when a stoichiometric 6m diameter cloud of methane or propane was ignited, it would not produce a pressure wave greater than 150 mbar. This was for open or partially enclosed spaces with blockage ratios up to 0.3 or 0. The performance standards from BP and Shell adopted this metric recommending to use 5m detector spacing / diameter cloud in order to detect the 6m diameter stoichiometric cloud, adding a level of conservatism to the experimental research result. It should be noted that these values were used in the historical performance standards and some recent performance standards, such as the BP General Practice (2017), have moved away from the 5m detector spacing recommendation.
Spherical Gas Cloud Approach
Detect3D makes use of this geographic method for gas mapping described above which employs the spherical gas cloud approach. Scenario, frequency and risk-based mapping can be implemented using in:Flux
The method is a three-dimensional assessment of point and open-path gas detectors which considers a spherical gas cloud at 100% LEL concentration (although other concentrations may also be used). The goal of the approach is to reduce the possibility of the 100% LEL spherical gas cloud existing in the facility and going un-detected. The size of the gas cloud is typically scaled based on the confinement and congestion of the region in question. The following gives examples of sizes that may be used. Some variations on the geographic approch exist, replace the below values with results from CFD or dispersion modeling.
-
5 meters for enclosed environments
-
8 meters for semi-enclosed environments
-
10 meters for open environments
Detectors are then positioned using the appropriate gas cloud size for the facility or module. A “field-of-influence” (FOI) is then generated for each detector; meaning, if the center of the gas cloud is located within the bounds of the FOI, the detector will go into alarm (see descriptions below for more detail).
-
Spherical FOI will exist for a point gas detectors
-
Rounded cylinder FOI will exist for open-path gas detectors
Point Gas Detector Representation (Field-of-Influence)
For point gas detectors, the field-of-influence (FOI) will directly correspond to the size of the spherical gas cloud. A 5-meter diameter gas cloud will result in a 5m FOI for the point gas detector, centered on the detector itself. This is true regardless of the manufacturer, make, or alarm setting of the detector.
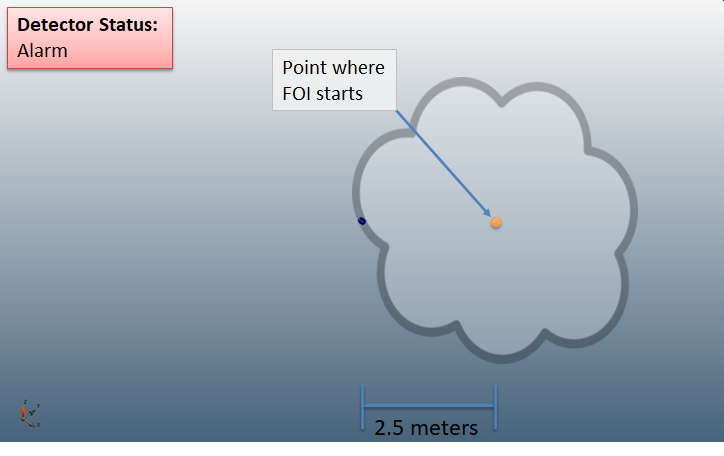
As an example to show how the FOI is calculated is described below. A gas detector is placed in the middle of the below image. A 5 meter 100% LEL concentration gas cloud is shown on the right. Currently the gas detector would NOT alarm since the gas cloud is not close enough to the detector.

Now that the edge of the gas cloud has touched the detector, in the below image, the detector will go into alarm because the cloud is at 100% of the LEL concentration. Thus, even the edge of the loud will put the detector into alarm. It is at this point that the center of the gas cloud starts dictating the FOI.
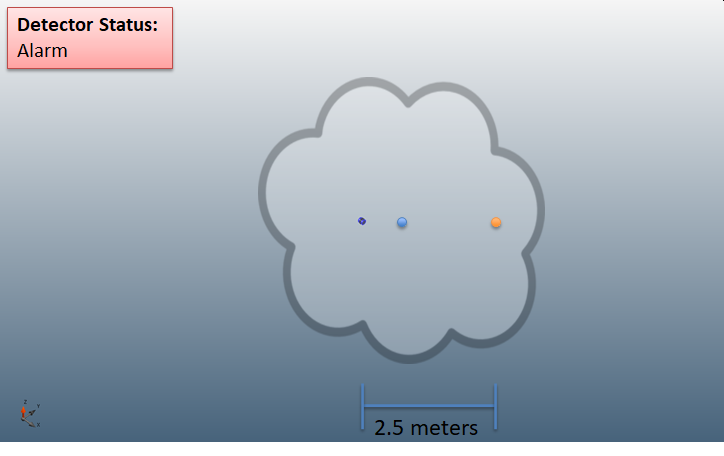
As the gas cloud continues to move past the detector, the detector will still be in alarm.
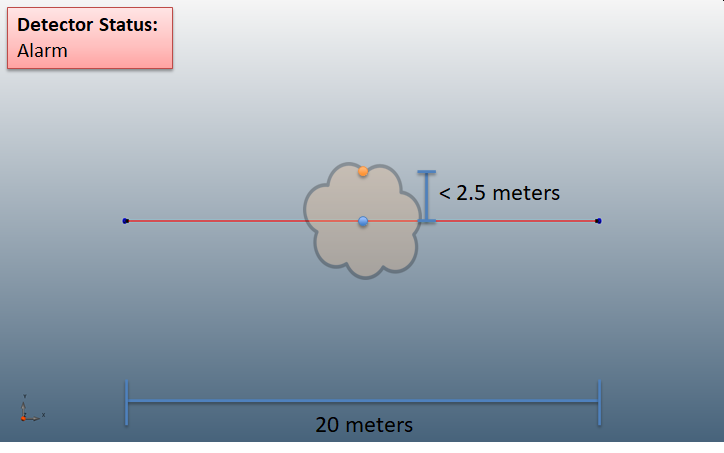
The detector will remain in alarm until the gas cloud has fully passed the detector. At this point the center of the gas cloud defines the other limit of the FOI for the detector.
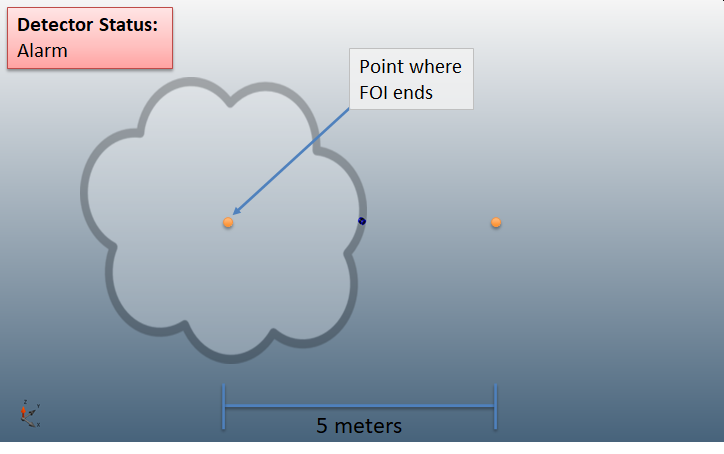
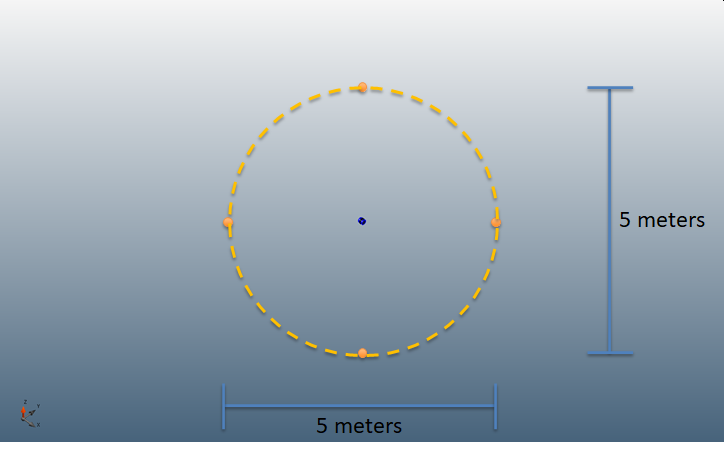
The two defining points (orange dots) for the bounds of the field-of-influence are then 5 meters apart. This will be the result regardless of the angle the gas cloud approaches the detector from. The FOI in each direction will be 2.5 meters away from the point gas detector.
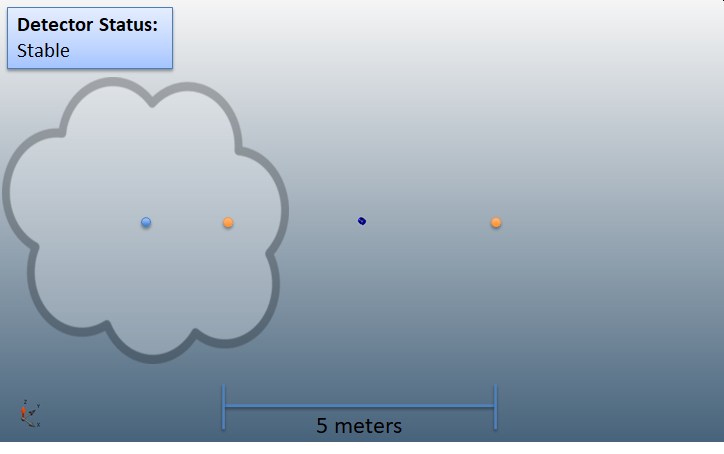
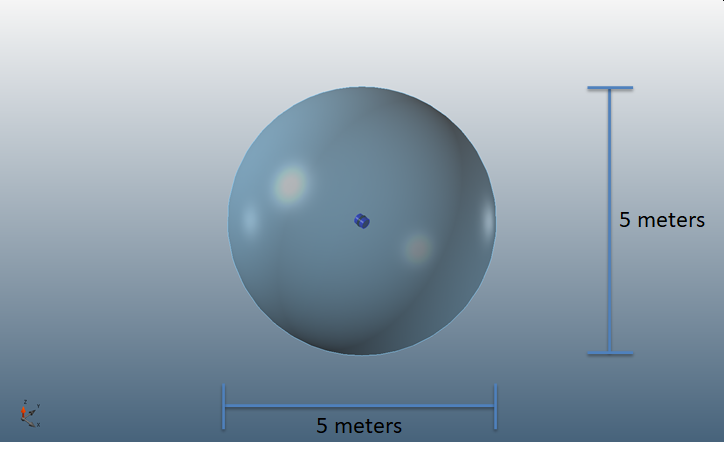
We can then draw a circle representative of the influence the detector has for detecting the 5 meter gas cloud. In Detect3D the FOI appear as a transparent blue sphere. The size of which will be based on the value entered in the risk grade.
Open-Path Gas Detectors Representation (Field-of-Influence)
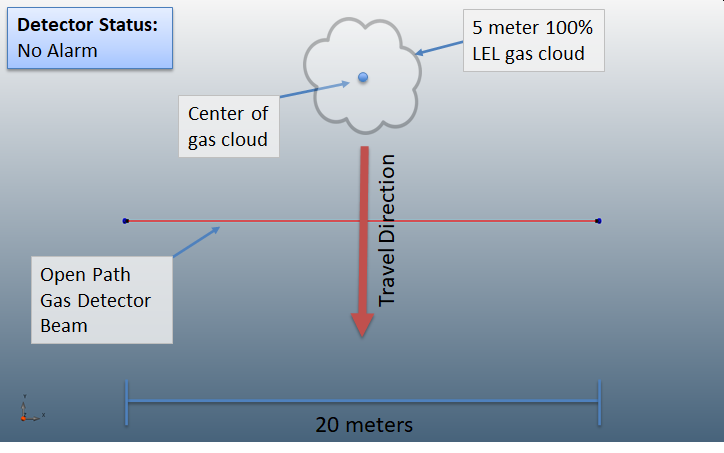
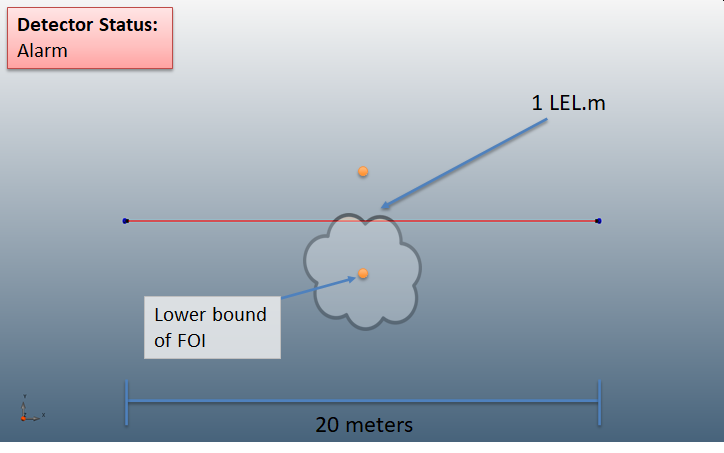
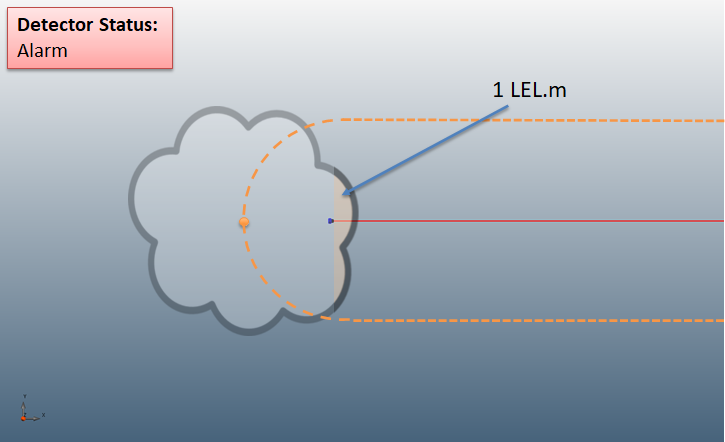
The field-of-influence (FOI) for open-path gas detectors is slightly more complex. The spherical 100% LEL concentration gas cloud must intersect the beam between the transmitter and receiver by a certain amount to go into alarm, usually 1 LEL.m to 5 LEL.m (LEL-meters). The FOI for an open-path gas detector resembles a rounded cylinder with the center-line on the beam, having a diameter slightly less than the diameter of the gas cloud. An open path gas detector is placed in the middle of the below image. A 5-meter diameter gas cloud at 100% LEL concentration will travel from the top of the image downwards. Currently the detector would NOT alarm since the center of the gas cloud is not close enough to the beam of detector.
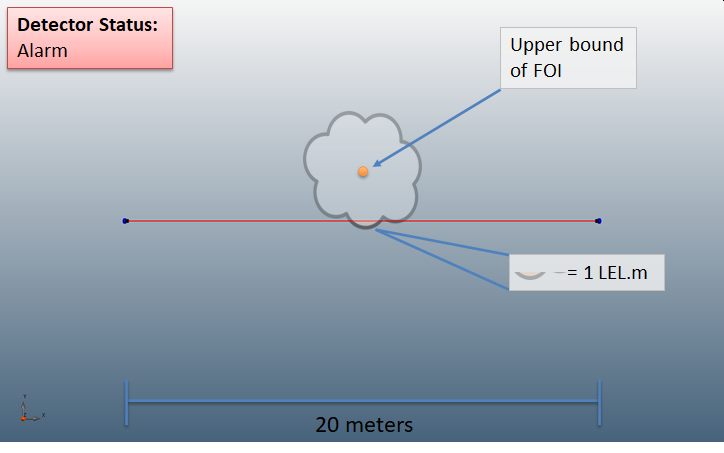
The method for open path detectors varies from the point gas detectors in that an equivalent of 1 meter of 100% LEL concentration of gas (the alarm setting) needs to cross the beam between the transmitter and receiver for the detector to go into alarm. The figure's orange dot is recorded as the upper bound of the FOI.
As the gas cloud travels down the detector remains in alarm as the threshold of 1 LEL meter has been exceeded. Note that the upper bound of the field of influence is less that the radius of the gas cloud.
The detector remains in an alarm state as long as there is 1 LEL-meter of gas crossing the beam. This point in the figure is recorded as the lower bound of the FOI as the gas cloud continues to move down the figure.
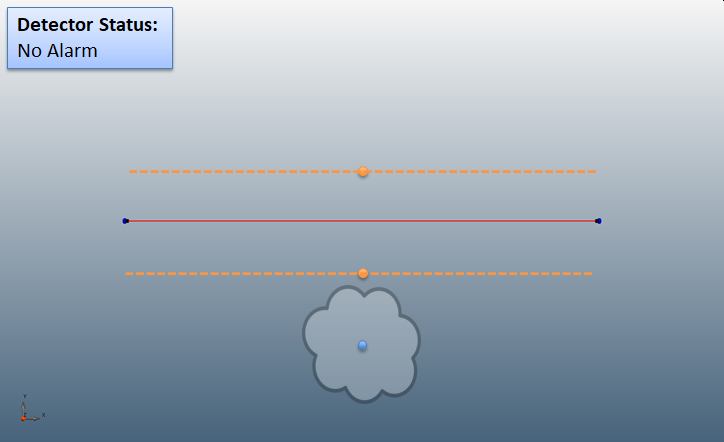
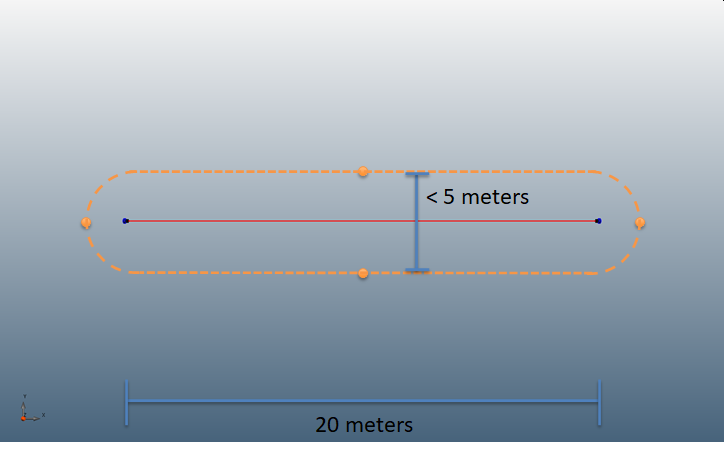
The detector returns to a stable status once the gas cloud no longer crosses the beam. The two dashed orange lines represent the upper and lower boundaries of the FOI for the length of the detector. The ends are left open discussed next.
The transmitter and receiver ends of the detector's FOI are defined in the same way as the length of the detector: an alarm state will occur when the equivalent of 1 LEL.m of gas crosses the beam. It is important to note that this does not mean that the FOI bounds are 1 meter from the end points.
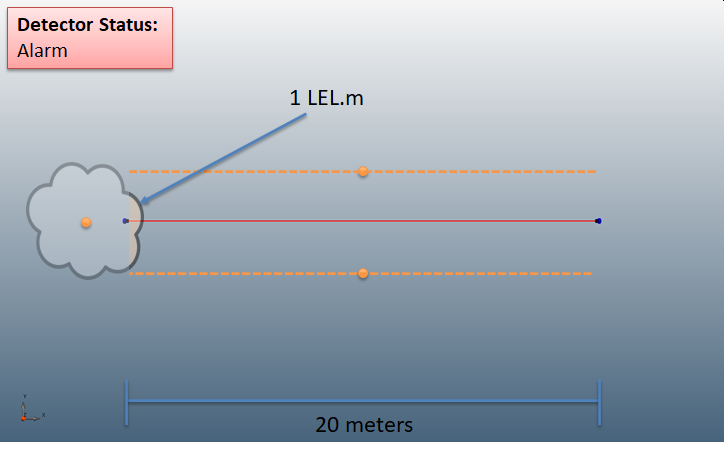
From this end of the open path gas detector, the bound for the FOI is defined by the center of the hypothetical gas cloud (orange dot) and is recorded when the equivalent of 1 LEL-meter exits between the transmitter and receiver ends of the detector. This will be the same distance regardless of the angle. The distance from the orange dot to the end of the open path gas detector will be less than the radius of the gas cloud.
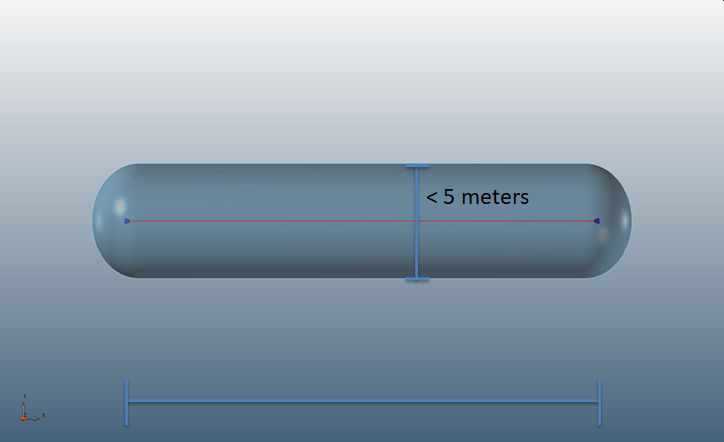
The bounds of the FOI can then be outlined for all the regions in which the equivalent of 1 LEL.m of gas crosses the beam and put the detector into an alarm state. The second image below shows the open path gas detector in Detect3D with a 1 LEL.m low alarm set point. It will appear as a transparent blue FOI in the 3D window.
What is an LEL-meter (LEL.m)?
An LEL.m can be thought of as 1-meter worth of gas at 100% LEL concentration. Since open-path gas detectors integrate concentration values across the beam, the LEL.m value can be thought of as the shaded area in the diagram below. It is this value which defines the low alarm setting of the device, setting how much gas needs to cross the beam in order for it to go into alarm.
The first example shows that if 1 LEL.m is the alarm setting, this is equivalent to 1 meter of 100% LEL gas cloud crossing the beam or as the second example shows, 5 meters of 20% LEL gas crossing the beam. This can be calculated for different LEL concentrations and different alarm settings and is why a higher alarm setting (e.g. 2 LEL.m) will result in a smaller FOI for the open path gas detector.

Description of open-path gas detector 1 LEL.m alarm setting for 100% LEL concentration

Description of open-path gas detector 1 LEL.m alarm setting for 20% LEL concentration