Reviewing Coverage Results
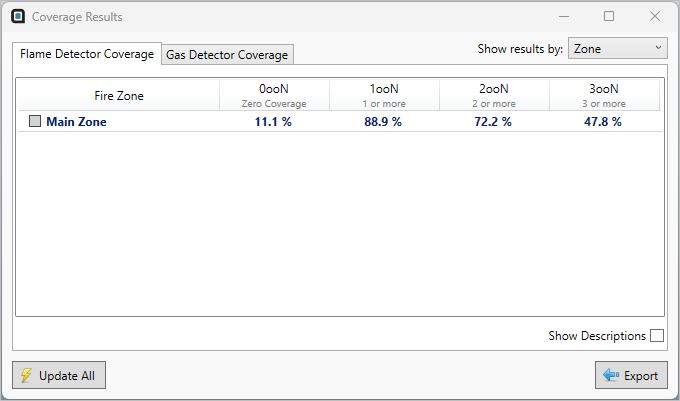
With the sub-zones defined and detectors added, coverage results can be reviewed. Select the Show Coverage Results icon ![]() on the toolbar. Your coverage values should be similar to Figure 28 below depending on the zone and sub-zone definition points chosen.
on the toolbar. Your coverage values should be similar to Figure 28 below depending on the zone and sub-zone definition points chosen.

Tutorial 4 - Figure 28 - Main Zone coverage results
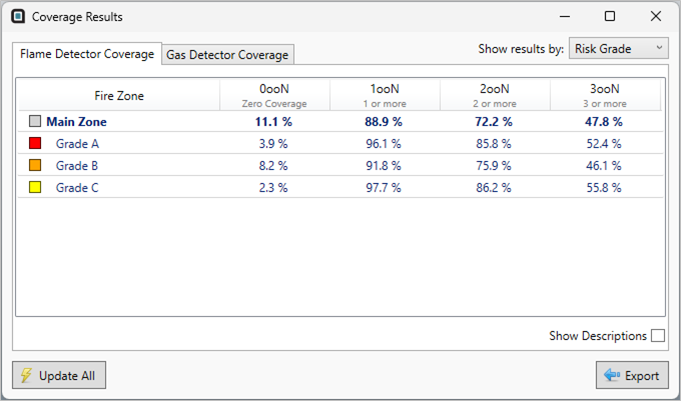
Click once on the Main Zone test in the Coverage Results Window or select Risk Grade in the Show results by: option in the upper right corner of the window. The table will expand to display the individualized coverage results for each risk grade. Each risk grade has a different coverage value as each was assigned to a different sub-zone.

Tutorial 4 - Figure 29 - Coverage by Risk Grade for the project
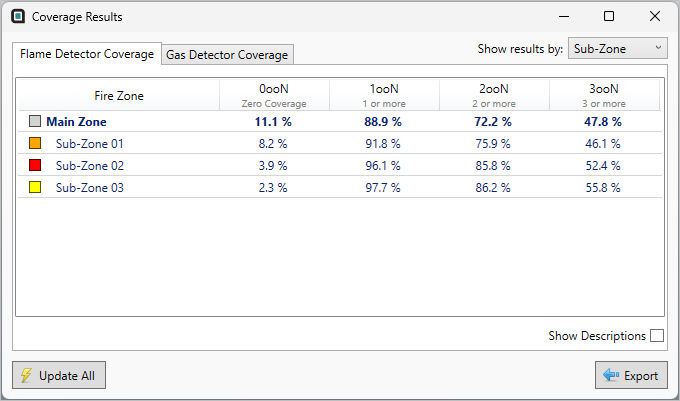
Click the Main Zone text again or select Sub-Zone as the Show results by option. Figure 30 shows the coverage results by sub-zone regions. These values will be the same as in Figure 29 as there is only one sub-zone assigned to each risk grade. Note each sub-zone has a color swatch indicating the associated risk grade used. If any of the risk grades assigned to the sub-zones change, the coverage values would change accordingly. Changing a zone's risk grade is discussed in Tutorial 5.
The coverage table can be exported to excel or PDF by clicking the Export button in the bottom right corner of the window.

Tutorial 4 - Figure 30 - coverage table displaying coverage values for each individual sub-zone in the project
This concludes Tutorial 4. You should now understand the three methods for defining sub-zones in Detect3D.
When you have finished viewing the results close the project.