Adding a Contour
Once a simulation is complete, you can add various visualizations to better understand the flow characteristics. As seen in the last section, contours are one way to visualize the range of a particular variable, in this case, wind speed across the domain. in:Flux allows you to define multiple contours on any of the three Cartesian planes: XY, YZ, or ZX. This section will go over adding a single contour to the project showing the streamwise velocity of the ventilation simulation.
-
Click the Add Item tab and select Contour from the dropdown menu.
-
The Name of the contour is automatically set. As you edit the fields in this panel the name will automatically change. You may manually enter a name by unchecking the checkbox next to Auto. For the in:Flux tutorials the automatic name will be used for the post-processing visualizations.
-
As we only have one simulation, the Westerly, 5 m/s will already be selected as the Simulation for the contour.
-
Set the Variable to Streamwise Velocity, m/s.
-
We will first preview a vertical plane to see that the boundary conditions of the flow are accounted for. Select ZX Plane from the On Plane dropdown menu.
-
Set the Y = value of the plane to "0" meters in the text box next to Offset at: When working with vertical planes, in:Flux's coordinate system changes so that a y=0 value represents the center line of the flow. This will be discussed more in Tutorial 6.
-
Leave the Relative to: value set to Domain, the Num Intervals: set to "20" and Clipping set to None.
-
Click the Preview checkbox to view a preview of the vertical contour. The figure below shows the Atmospheric Boundary Layer (ABL) upstream of the tanks, which is discussed in more detail in the in:Flux Theory Guide found under the Help Menu

Tutorial 1 - Figure 22 - A preview of a streamwise velocity contour placed on the ZX Plane
-
Change the plane of the contour by choosing XY Plane from the On Plane: dropdown menu.
-
Set the height of the contour by changing the Offset at: text box to Z = "1.5" meters.
-
The preview of the contour will be updated automatically. Contours can be defined at any height, a value of 1.5m was chosen to show the interaction of the flow with the obstructions of the large tanks and flanges.
-
You can change the coloring and scaling for the contour by clicking the arrow next to Coloring. Here you can change things like the Color Map Palette, Opacity, and the Ranges. The rest of this tutorial and the other tutorials in this guide will use the default settings. Tutorial 6 further describes the color map palettes of in:Flux.
-
-
Select the Add Item button to add this contour to the project.
Upon clicking the Add Item button, a legend for the contour will appear on the right side of the 3D window. in:Flux's smart legend will automatically sync to the first displayed visualization of the project, editing the legend will be discussed in a later tutorial. Figure 23 shows the added contour and corresponding legend for the streamwise velocity of the westerly 5m/s ventilation simulation.

Tutorial 1 - Figure 23 - The current in:Flux window showing the streamwise velocity contour placed on the XY plane at 1.5 meters height.
Before continuing to the next section, turn off the visibility of the contour by deselecting the checkbox next to its name under the Visualization -> Contours heading in the Project Items Tab as shown in Figure 24.
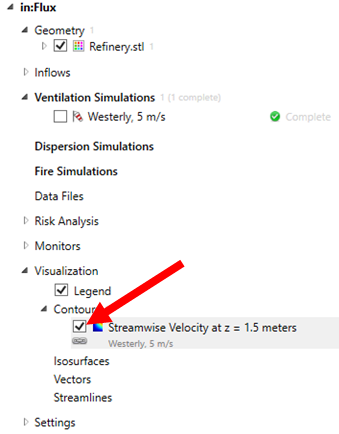
Tutorial 1 - Figure 24 - Indication of checkbox to deselect for turning off the visibility of the contour in the 3D window