Viewing Monitor Point Data and Exporting to Excel
Once monitor points have been added to the project, you can view the tabulated data in the Monitor Point Data window.
To open the Monitor Point Data Window:
Select Monitor Point Data from the Project menu, or select the ![]() icon on the toolbar, a warning will appear saying "Some data for the monitor
points is not up to date," click OK, and then click the Update button (
icon on the toolbar, a warning will appear saying "Some data for the monitor
points is not up to date," click OK, and then click the Update button (![]() ) in the upper right corner of the Monitor Point Data window.
) in the upper right corner of the Monitor Point Data window.
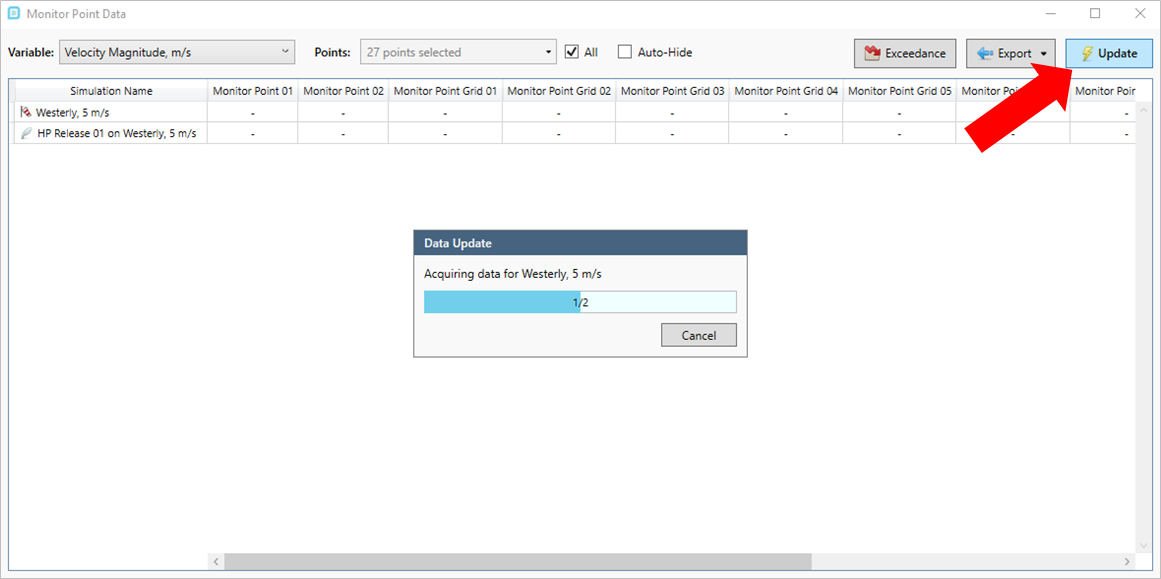
Tutorial 3 - Figure 9 - Monitor Point Data window being updated after clicking the Update button.
We see in that the columns are made up of the monitor points that have been added to the project, and the rows correspond to the simulations that have been completed. Initially the Variable is set to Streamwise Velocity, m/s. Figure 10 shows Monitor Point 01 and Monitor Point 02 both have low values for the wind speed and some of the other grid points have negative values. This can be visually checked by looking at the contours and vectors defined in Tutorial 1 (see Figure 11). Here the blue vectors indicate flow in the opposite direction of the wind, resulting in negative values for the monitor point streamwise velocity values.
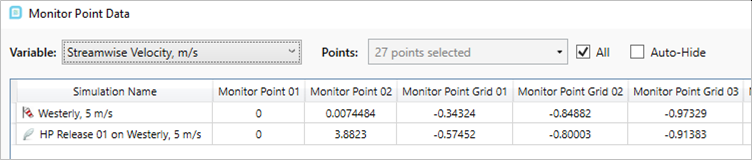
Tutorial 3 - Figure 10 - Zoomed view of Monitor Point Data Window displaying the streamwise velocity values for the monitor points.
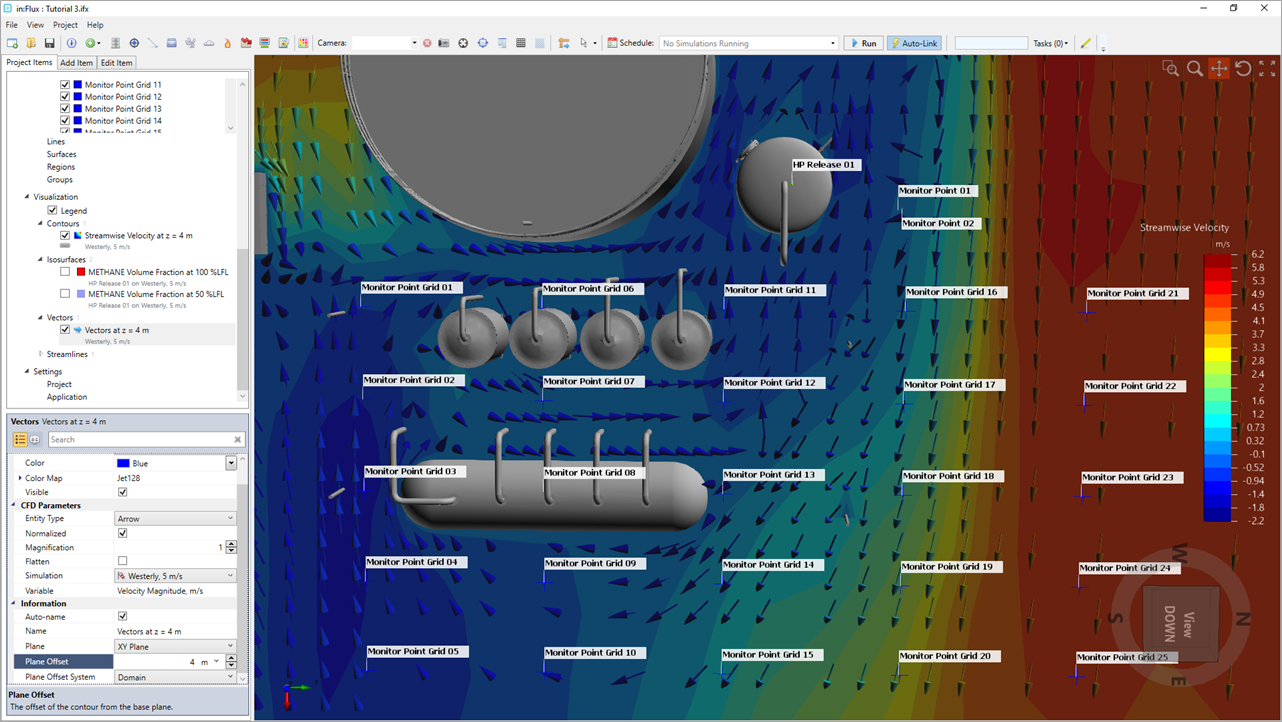
Tutorial 3 - Figure 11 - Showing Streamwise Velocity contour and vector field verifying some of the monitor point data obtained. Offset height set to 4m for both visuals.
Change the Variable dropdown menu at the upper left side of the monitor point data window to Flammable Gas Volume Fraction, %LFL. Here it can be seen that Monitor Point 02 has the highest value. This is expected as this point is located closest to the 50% LFL isosurface defined in Tutorial 2.
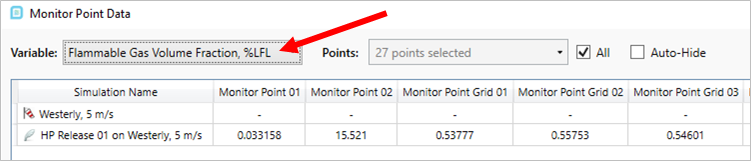
Tutorial 3 - Figure 12 - Zoomed view of Monitor Point Data for the %LFL.
You can change the number of monitor points shown in the window by de-selecting the All checkbox and using the Points: dropdown menu to select the desired points.
Let's compare a few specific monitors by selecting 'Monitor Point 02', 'Monitor Point Grid 21', 'Monitor Point Grid 22', 'Monitor Point Grid 23', 'Monitor Point Grid 24' and 'Monitor Point Grid 25' from the dropdown menu, as shown in Figure 13 below. Six monitor points in total.
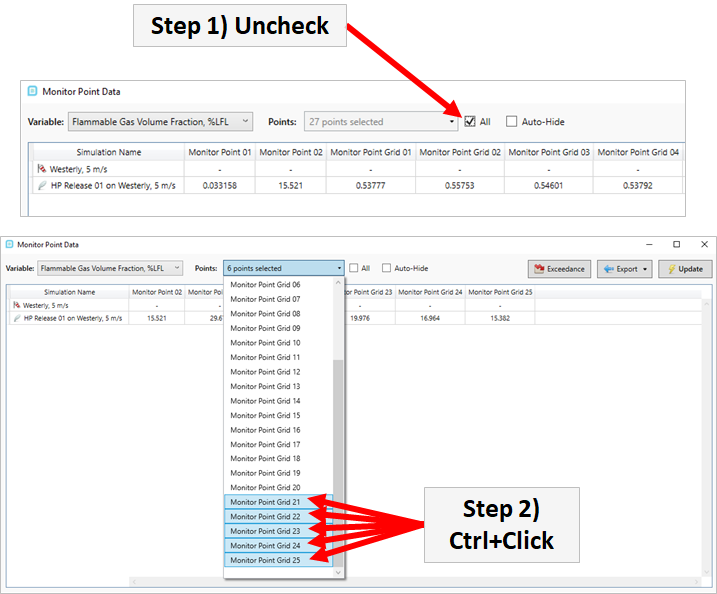
Tutorial 3 - Figure 13 - Process for selection of individual monitor points to view their data, rather than all monitor points in the project
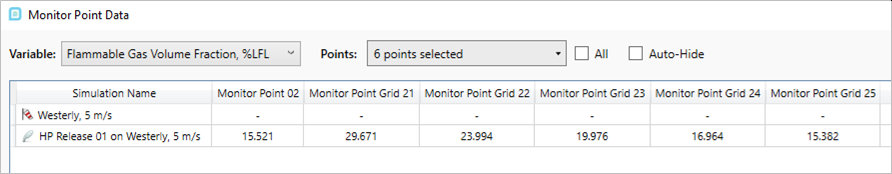
Tutorial 3 - Figure 14 - Monitor Point Data window after only six points have been selected for viewing
Here, as shown in Figure 14, it is easier to compare the %LFL values of these specific points.
Since there is no limitation to the number of monitors that can be added to a project, this feature will become more useful as more monitor points are added. All the data in these tables can be exported to excel either with a single variable or with
all the variables. Before exporting this data, be sure to turn back on all the monitor points by selecting the All checkbox (![]() ) otherwise only
the six displayed monitor points above will be exported.
) otherwise only
the six displayed monitor points above will be exported.
Entering Info For Exported Excel Reports
In the first tab of the excel file there will be a cover sheet listing the date, time of creation, and project information. To edit the project information, return to the in:Flux main window and select the Project Information option from
the Project menu, alternatively you can click the ![]() icon on the toolbar. The following window will appear to allow for information to be entered
about the project. Text is automatically saved so there is no need for a save button or to press enter on your keyboard. Click Close when finished.
icon on the toolbar. The following window will appear to allow for information to be entered
about the project. Text is automatically saved so there is no need for a save button or to press enter on your keyboard. Click Close when finished.
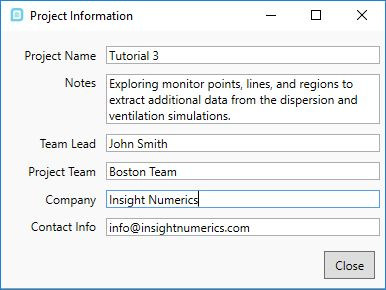
Tutorial 3 - Figure 15 - Project Information window example text
Return to the Monitor Point Data window and click the Export button (![]() ) and select Selected Variable from the dropdown menu
and choose a title, such as "Tutorial 3 Monitor Point Data" and set the save location for the excel file.
) and select Selected Variable from the dropdown menu
and choose a title, such as "Tutorial 3 Monitor Point Data" and set the save location for the excel file.
Open the excel file and see that the project information you entered is present on the cover page. If All Variables was selected when exporting, then every variable that is saved by in:Flux would be listed as a separate tab in the excel file. For simplicity, we only exported the volume fraction of Methane in terms of LFL.
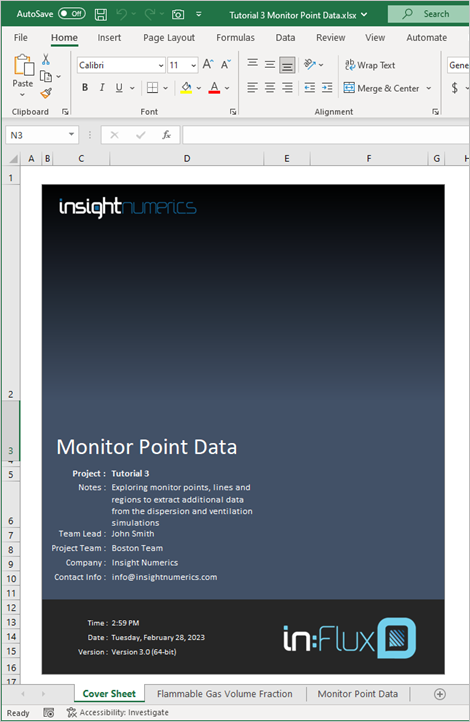
Tutorial 3 - Figure 16 - Screenshot of exported excel file from the monitor point data window
In the 'Flammable Gas Volume Fraction' tab, shown in Figure 17, that the properties of the gas leak are listed first and then the associated data for each monitor point. The exported excel data will have more significant digits than the Monitor Point Data window.
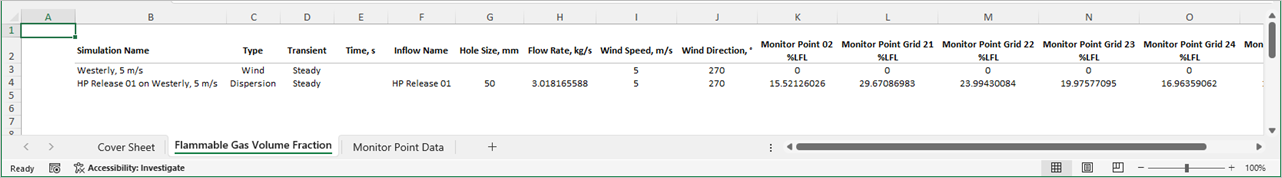
Tutorial 3 - Figure 17 - Monitor point data exported to excel, showing the Flammable Gas Volume Fraction in %LFL for each point.
The other tab 'Monitor Point Data' will be a list of the tag names and associated X, Y and Z coordinates of each monitor point.
The next section will go over the addition of a monitor line to the project.