Clipped Contours
Contours of in:Flux are automatically defined to color every region across the chosen plane. For some simulations, it may be more desirable or aesthetically pleasing to have a contour in which only values of significant importance are shown. For this in:Flux allows for contours to be "clipped" to the user defined minimum and maximum values.
For this example, we will add a new contour and then edit it to be clipped using Tutorial 5:
-
Load Tutorial 5.ifx from the downloaded tutorial zip file and turn off any visualization that may be displaying.
-
Click the Add Item tab and select Contour from the dropdown menu.
-
Leave the Name as the automatically defined one
-
Choose HP Release 02 on Easterly, 5 m/s as the Simulation
-
Set the Variable as METHANE Volume Fraction, LFL
-
On the XY Plane set the Offset to Z = "5.5" meters
-
Uncheck the Auto-Range checkbox and ensure the min value is "0" and max value is "1"
-
Click Add Item
-
In the Project Items tab select the newly added contour to open its properties panel.
-
Sync the legend to the new contour by right-clicking METHANE Volume Fraction, LFL and choose
 Link to Legend, your
window should appear similar to the figure below.
Link to Legend, your
window should appear similar to the figure below.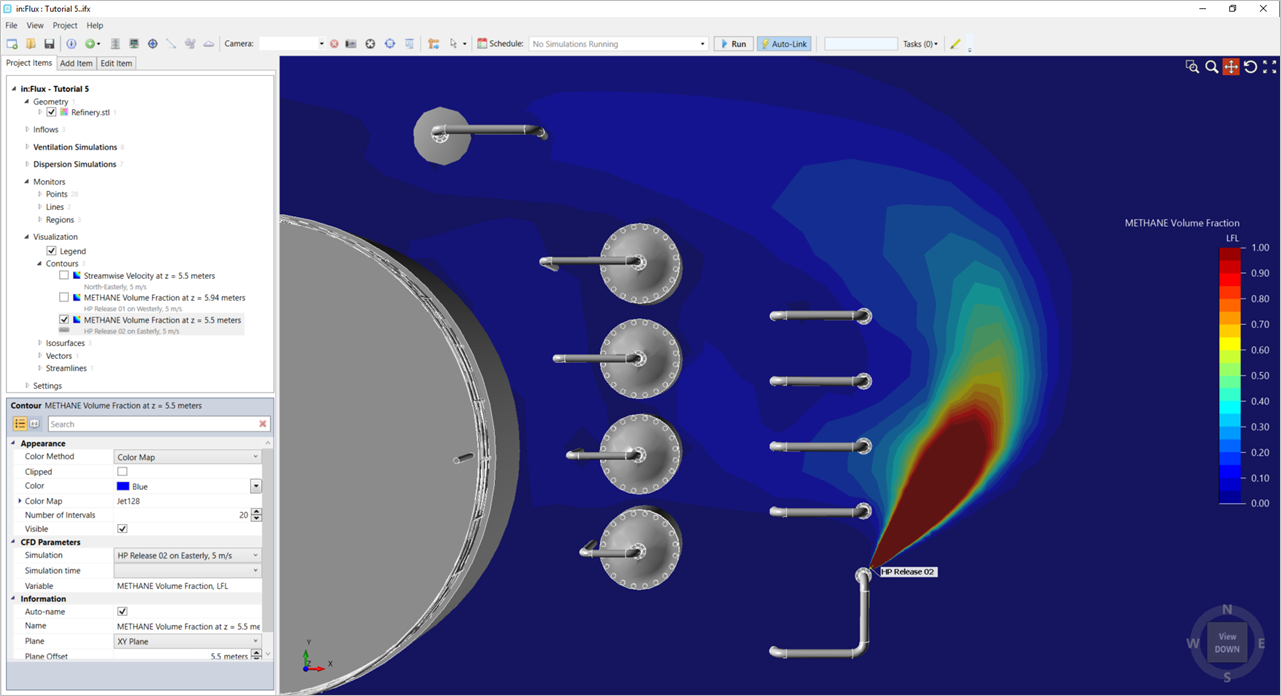
Tutorial 6 - Figure 68 - Contour for methane volume fraction with legend linked
-
In the properties panel of the contour, click the small triangle to the left of the Color Map header option in the Appearance section to expand the color map options. Note that you can change already defined contours to be clipped starting with this step.
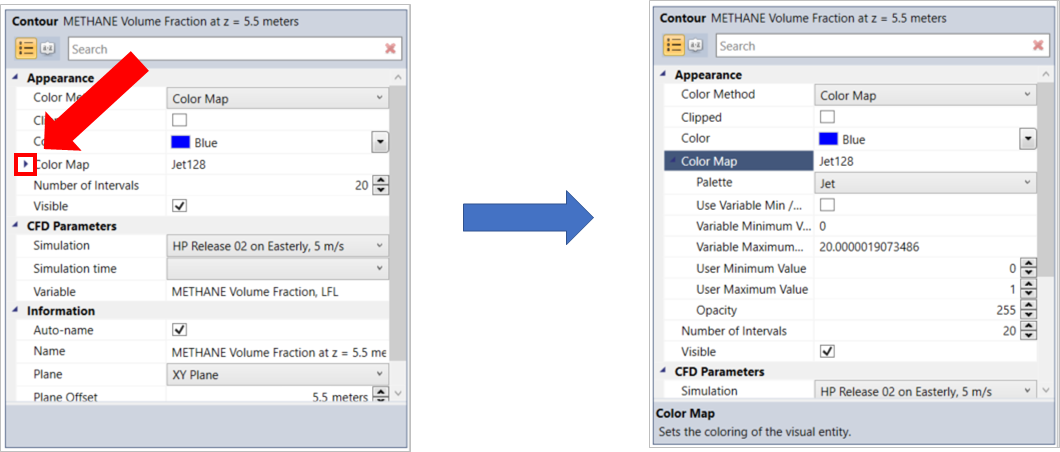
Tutorial 6 - Figure 69 - Indication for opening the 'Color Map' section of the properties panel for the selected contour
-
Ensure that Use Variable Min / Max is unchecked.
-
Enter a value of "0.1" as the User Minimum Value. Changing this value affects the lower bound of the clipping, thus no coloring will appear for values lower than 0.1 on the contour. Note that because LFL was selected as the variable and not %LFL, the range is from 0 to 1 as we defined. If %LFL was chosen 0 to 100 should be used.
-
Select the Clipped checkbox to clip the contour to the specified value in Step 13, as in the figure below.
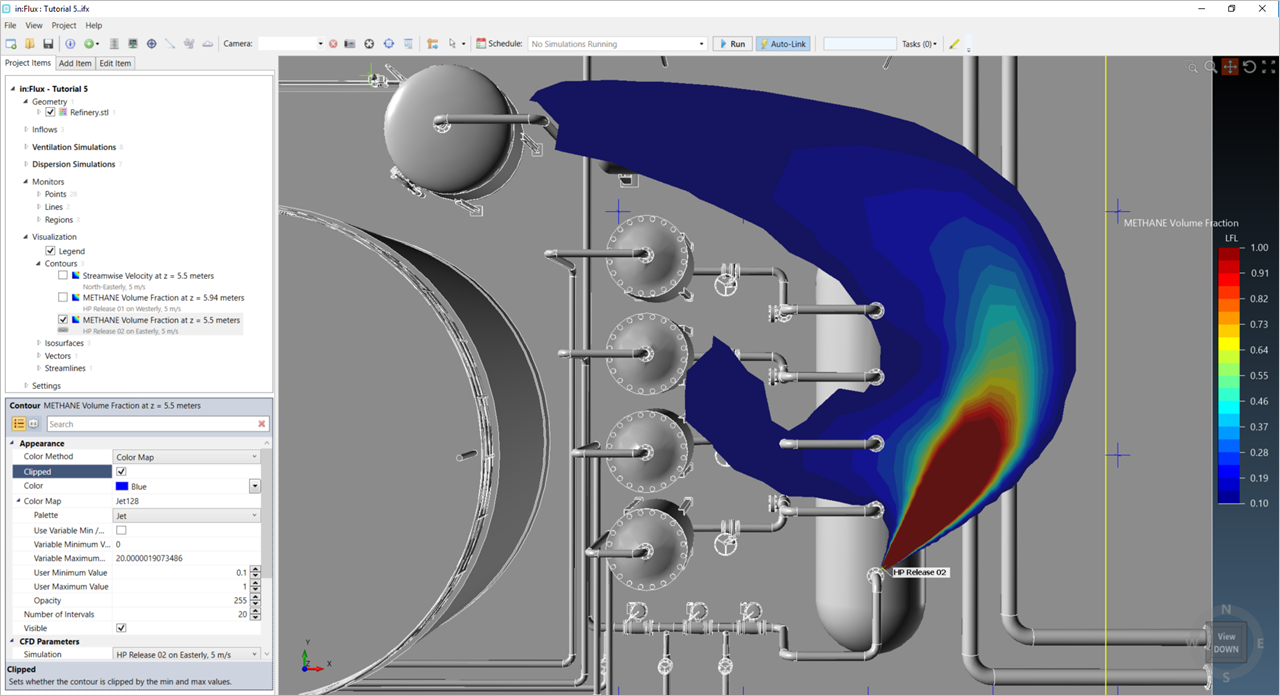
Tutorial 6 - Figure 70 - in:Flux window showing the contour clipped from the defined minimum value
-
As mentioned in the Color Map section, it is suggested to explore color map palette's other than jet. For this example, change the Palette to be Viridis for the resulting figure.
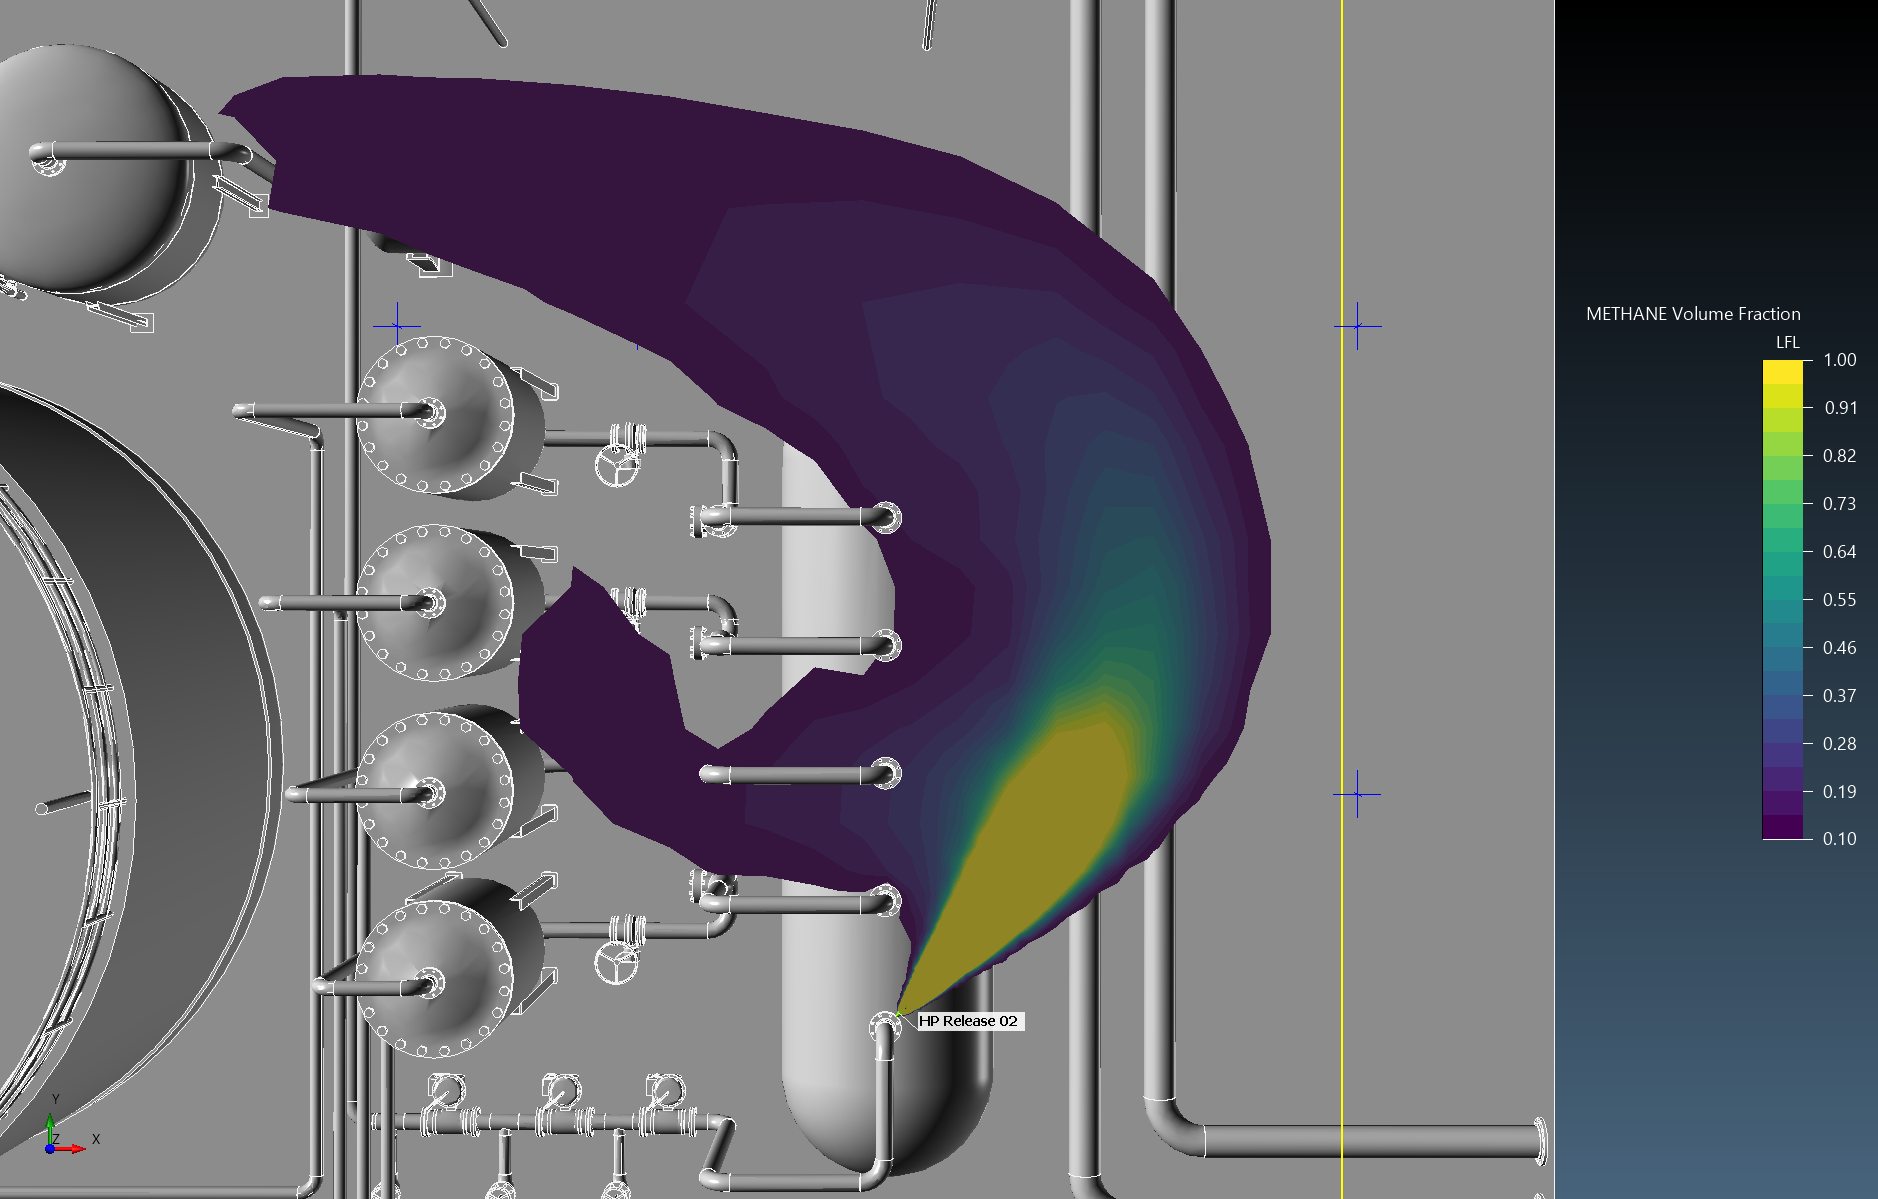
Tutorial 6 - Figure 71 - clipped contour with color map set to Viridis