Reviewing Exceedance Curves for Gas Cloud Volumes
Since each simulation of this tutorial has a leak frequency associated with it, we can use that data to plot exceedance curves for various results. These exceedance curves can be generated for any monitor (point, line, surface, region) in the in:Flux project. For this example an exceedance curve will be generated via the already defined monitor region, which will show exceedance of the various gas cloud sizes.
To view an exceedance curve, click on the Monitor Exceedance Curves button (![]() ) on the tool bar, or select the same in the Project Menu. This
will open the window shown in figure below.
) on the tool bar, or select the same in the Project Menu. This
will open the window shown in figure below.
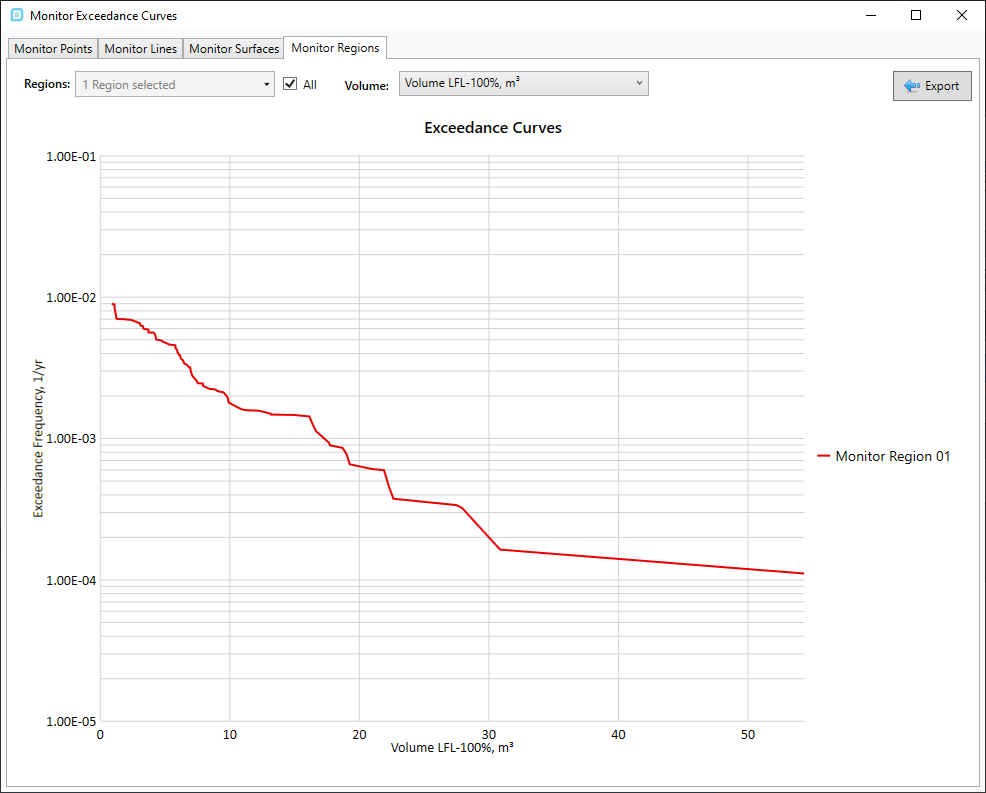
Tutorial 11 - Figure 34 - Exceedance curve of gas cloud volume LFL-100% for the project
The top of the window has tabs for each type of monitor, this project only has a single monitor region so it is the only tab with data. The Volume dropdown menu (shown below) allows for different gas cloud volume variables and ranges to be selected. These are the same as what is listed in the gas cloud analysis window.
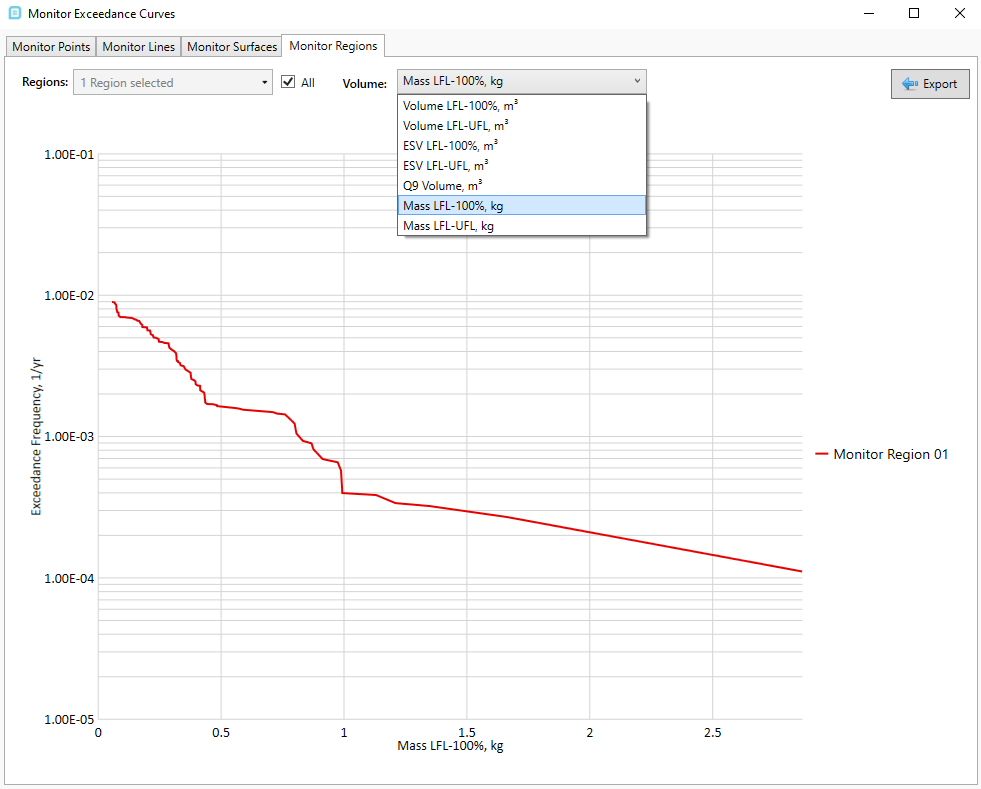
Tutorial 11 - Figure 35 - Exceedance curve of gas cloud volume - Mass LFL-100%
The graph and associated data can be exported to excel for further analysis by clicking the Export button in the upper right corner.
This concludes Tutorial 11. You should now understand setting up and reviewing scenario, frequency and risk results for an example facility.
Save your project and continue to Tutorial 12 to use the generated risk data to run gas detector optimization using CFD results.