Viewing Gas Cloud Data and Exporting to Excel
Monitor Regions can provide data on gas cloud sizes, custom gas cloud volume information, but also minimum, maximum and average values for any variable within the region. This data is only available for completed simulations and can only be viewed once a monitor region has been defined.
There are three windows which provide different types of information on results within the defined region:
-
Volume Analysis Window (
 ) - discussed below, provides the total mass and volume of the established gas plume contained within the defined region. This information can then be used for
further analyses such as gas detector mapping or explosion modeling.
) - discussed below, provides the total mass and volume of the established gas plume contained within the defined region. This information can then be used for
further analyses such as gas detector mapping or explosion modeling. -
Monitor Region Data (
 ) - similar to monitor line data, variables can be selected and the average, minimum and maximum
values of that variable within the region are shown for each completed simulation in the project
) - similar to monitor line data, variables can be selected and the average, minimum and maximum
values of that variable within the region are shown for each completed simulation in the project -
Ventilation Analysis Window (
 ) - provides information pertaining to studies analyzing ventilations,
such as air changes per hour, average velocity, minimum wind chill temperature and average wind chill temperature.
) - provides information pertaining to studies analyzing ventilations,
such as air changes per hour, average velocity, minimum wind chill temperature and average wind chill temperature.
The Volume Analysis window can be opened by selecting its name from the Project menu, or selecting the ![]() icon on the toolbar. The window that opens will appear as Figure 27 below.
If prompted, click the Update (
icon on the toolbar. The window that opens will appear as Figure 27 below.
If prompted, click the Update (![]() ) button at the lower left of the window to update the monitor region data. The rows of the table correspond to the simulations
that have been completed, and the columns are the following terms:
) button at the lower left of the window to update the monitor region data. The rows of the table correspond to the simulations
that have been completed, and the columns are the following terms:
-
Volume LFL - 100%: meaning the volume of gas between the LFL concentration and 100% concentration. For example, methane would be 5% - 100% concentration.
-
Volume LFL - UFL: the volume of gas between the lower flammability limit and the upper flammability limit
-
Equivalent Stoichiometric Volume of LFL to 100%
-
Equivalent Stoichiometric Volume of LFL to UFL
-
Q9 Volume (in m3)
-
Mass (in kg) of the gas cloud between the LFL concentration and 100% concentration.
-
Mass (in kg) of the gas cloud between the lower flammability limit and the upper flammability limit
-
Custom Gas Clouds can also be set for enter values, e.g. volume of gas >60%LFL, etc. and is discussed in the next section
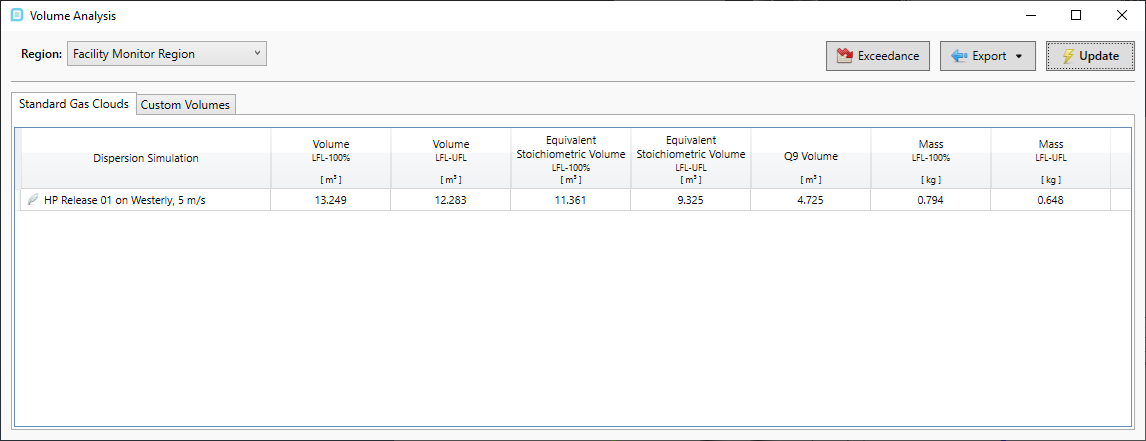
Tutorial 3 - Figure 27 - Gas cloud analysis data for the METHANE HP release calculated in Tutorial 2
The entire table will change depending on which monitor region is selected in the dropdown menu at the upper right corner. Change the Monitor Region dropdown to the Lower Flanges Monitor Region and see that all the values are zero (as shown in Figure 28 below). This can be expected as the isosurface of the 50% LFL gas cloud points in the opposite direction of the monitor region. As the plume does not cross the region there are no values for the volume of gas here. As this file is used in Tutorial 5 this regions purpose will become more relevant when more dispersions are run.
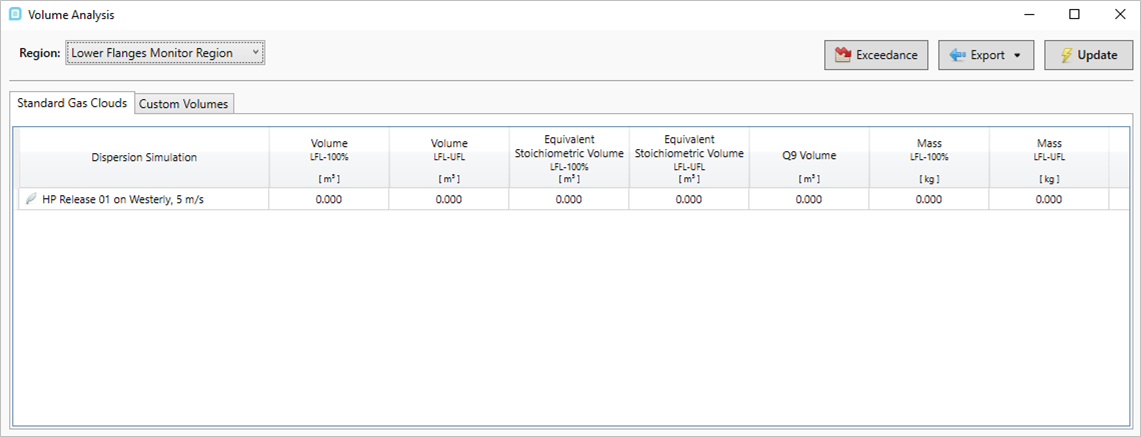
Tutorial 3 - Figure 28 - Gas cloud analysis data for the Equipment Monitor Region
Switch the Monitor Region dropdown to the Equipment Monitor Region, the regions values are present as it encompasses part of the release but still not as high values as the facility monitor region.
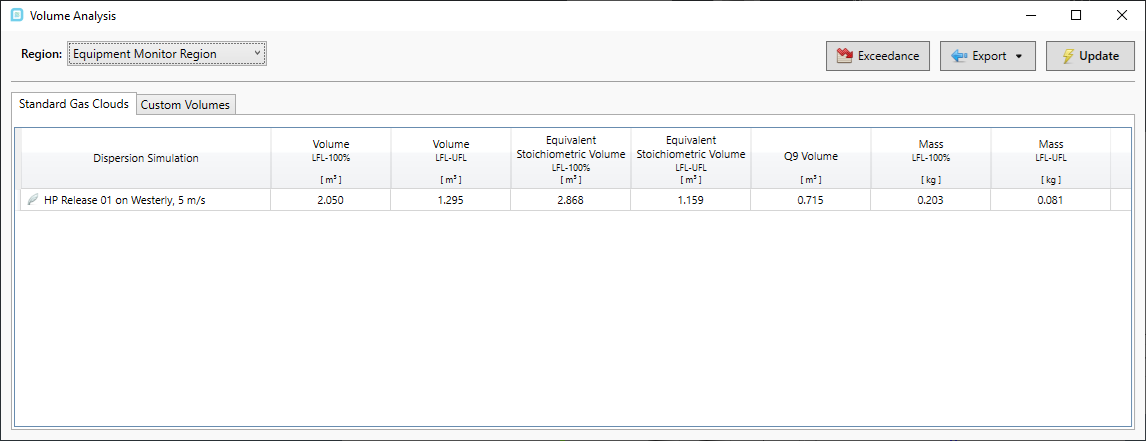
Tutorial 3 - Figure 29 - Gas cloud analysis data for the Equipment Monitor Region
Click the Export button (![]() ) at the bottom right of the window, and select All Regions, then give the file a name such as "Tutorial 3 Monitor Regions"
and choose a location to save it.
) at the bottom right of the window, and select All Regions, then give the file a name such as "Tutorial 3 Monitor Regions"
and choose a location to save it.
The created excel file will appear similar to that of the monitor point data document with a cover page on the first tab. Scroll through the tabs to find data of each monitor region. The exported results will have information about each simulation (hole size, flow rate, etc) and more significant digits than the Gas Cloud Analysis Window.
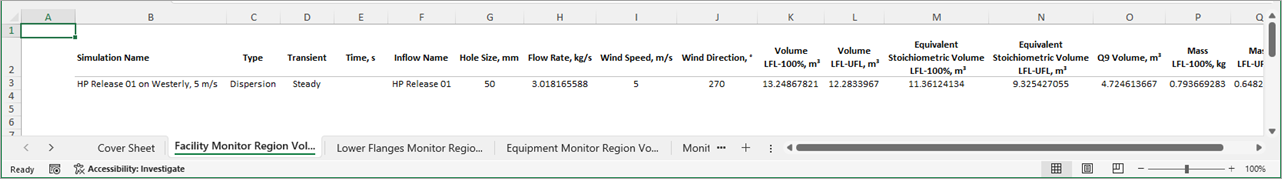
Tutorial 3 - Figure 30 - Excel data for the Facility Monitor Region
Continue to the next section to go over custom gas clouds.