View Monitor Data
For this last section a series of line spaced monitor points will be added and spot measurements of results will be reviewed for the fire simulation.
-
From the Add Items Tab, set the Select Item as Monitor Point
-
Set the Method to Line Spaced
-
Enter the following coordinate for the First Point ( 13.5, 29.5, 3.5) and the Second Point as ( -6, 29.5, 3.5)
-
Set the # Points to 7 and click the Add Item Button
-
Stay in the Add Item panel and change the Name to "Monitor Point 08" and continue adding four more monitors on the other part of the walkway
-
Enter ( -6, 44, 3.5) for the First Point and ( -6, 33, 3.5) for the Second Point
-
Set the # Points to 4 and click Add Item
You should now have 11 monitor points added to the project, as shown below.
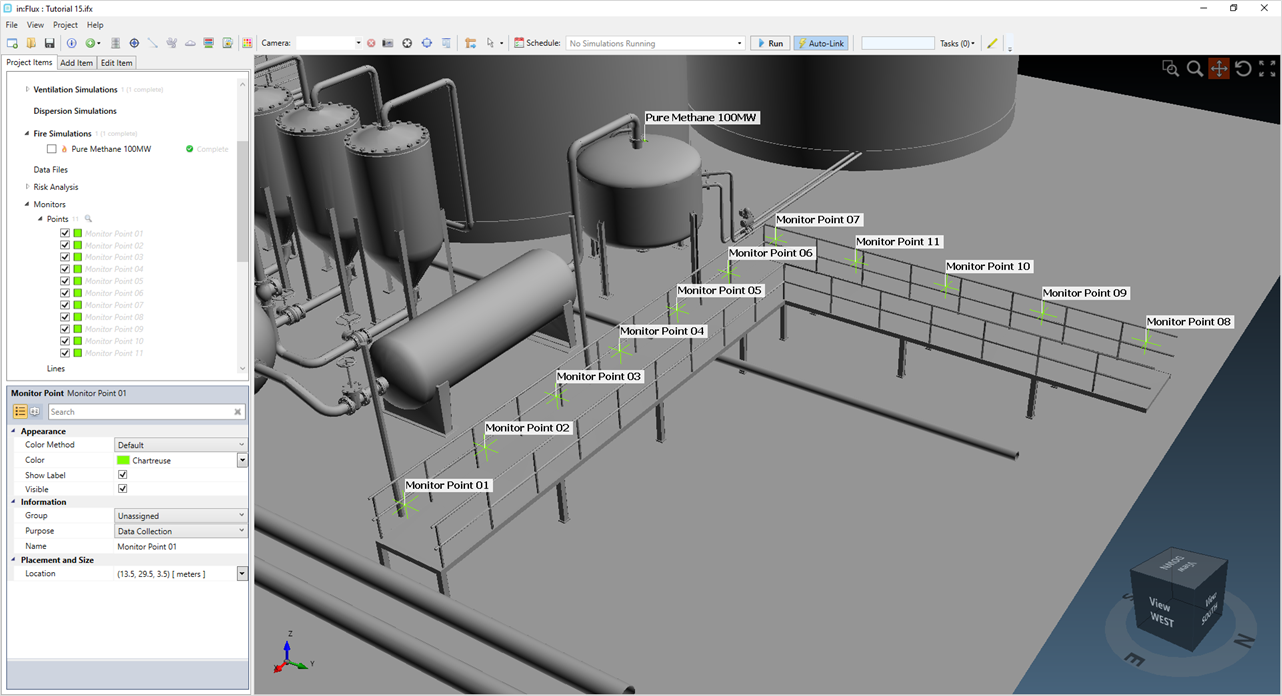
Tutorial 15 - Figure 11 - Monitor Points defined along the walkway of the refinery
Open the Monitor Point Data window ( on the toolbar ![]() ) and click the Update button in the upper right side. Change the Variable dropdown
menu first to Incident Radiation, kW/m2. Note that several of the values in the corner nearest the fire are above kW/m2. You may also have the radiation values take account for solar radiation by applying a solar radiation intensity value.
) and click the Update button in the upper right side. Change the Variable dropdown
menu first to Incident Radiation, kW/m2. Note that several of the values in the corner nearest the fire are above kW/m2. You may also have the radiation values take account for solar radiation by applying a solar radiation intensity value.
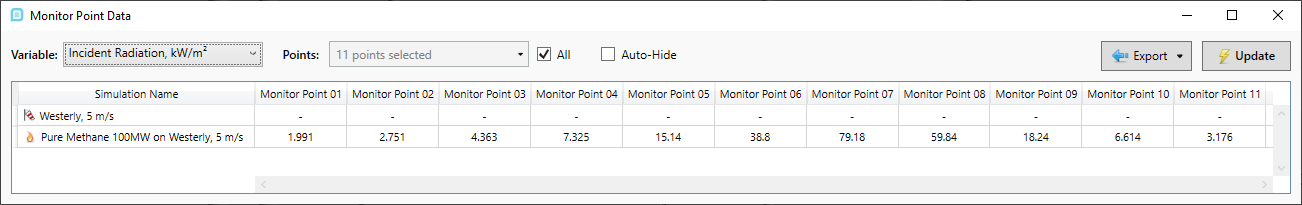
Tutorial 15 - Figure 12 - Incident Radiation values along walkway.
Now change the Variable to Carbon Dioxide Volume Fraction, ppm. Here we can see Monitor Point 07 and 11 (closest to the fire) have the highest values, which is to be expected. Reviewing these concentrations are important as higher values can be detrimental to personnel. Some use this information to calculate carbon monoxide levels, as described here, which is dependent on how well ventilated the flame is.
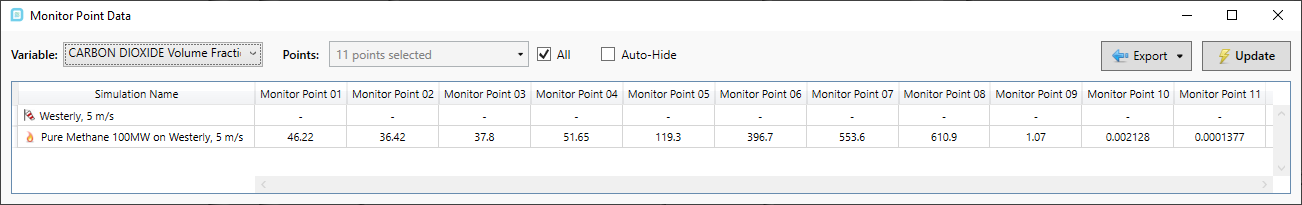
Tutorial 15 - Figure 13 - CO2 ppm values for monitors along walkway
You have now finished your first fire simulation project with in:Flux!
This concludes Tutorial 15, save your project before closing as it will be the basis for the later tutorials.