Reviewing Monitor Data Results
As monitor points were already defined in Tutorial 15 they are available here. If monitors are defined before cases are run then the data is automatically updated when the simulation completes. Otherwise, the information will need to be updated when opening the monitor data window.
Open the Monitor Point Data Window and change the Variable to Incident Radiation, kW/m2. Here we see Monitor Point 07 or Monitor Point 08 having the highest values on the walkway and even for the 50MW fire case would hinder the walkway as an escape route.
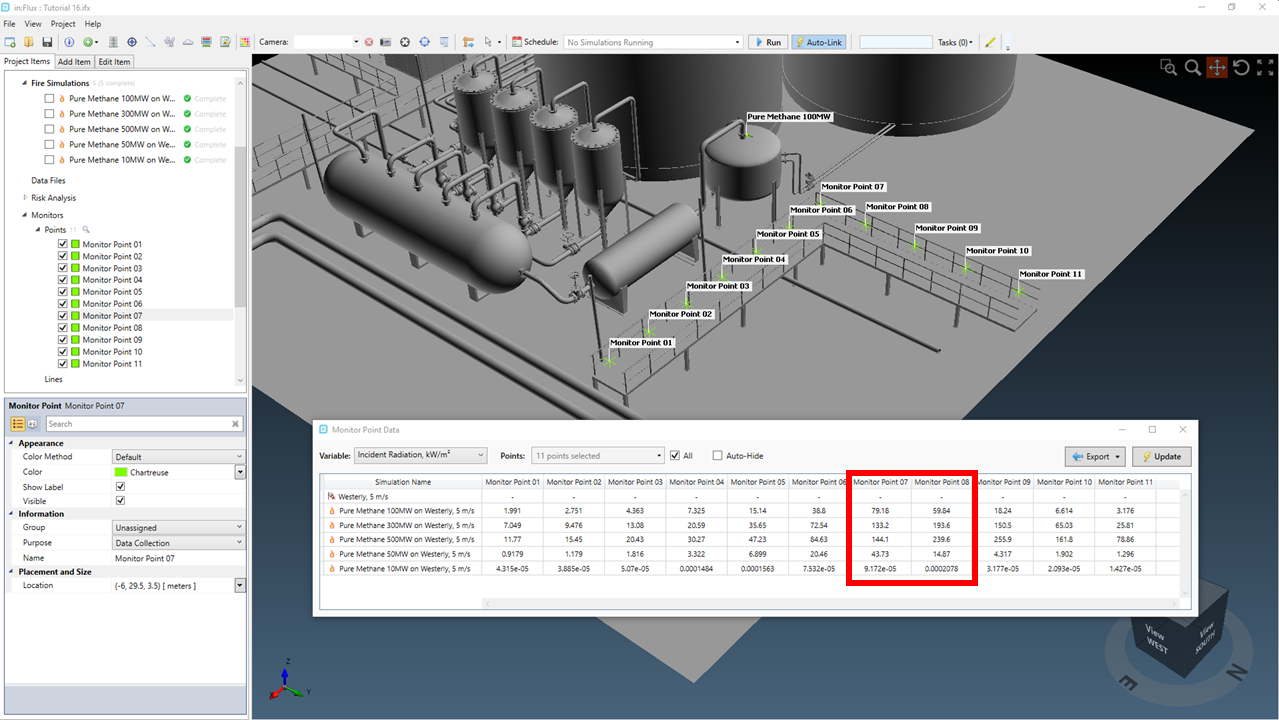
Tutorial 16 - Figure 07 - in:Flux window showing the monitor point data highlighting the high values for Monitor Point 07
Click the Export button at the upper right of the window and choose All Variables. In the Excel each tab will have a different variable listing the data at each monitor point for each fire case. Conditional Formatting can be applied to quickly distinguish the upper and lower levels of the data sets. Below shows two screenshots: one of the Incident Radiation and the other of the Soot Volume Fraction, ppm values.
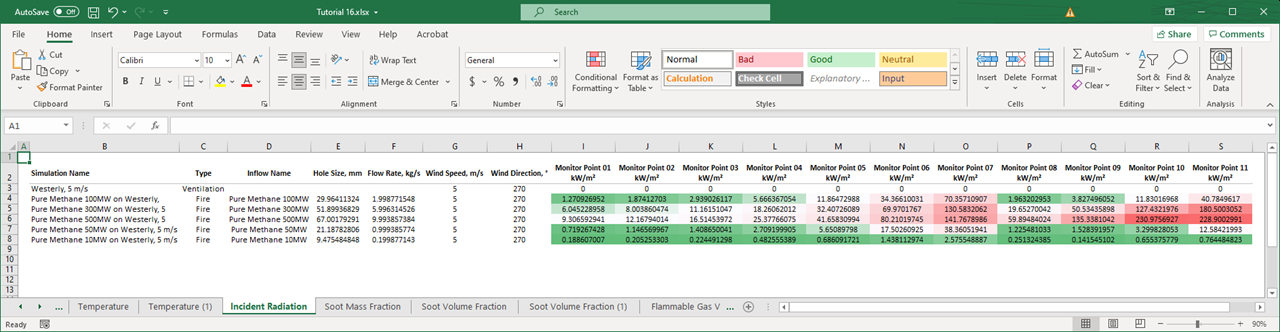
Tutorial 16 - Figure 08 - Excel output with conditional formatting for Incident Radiation at each of the defined monitor points
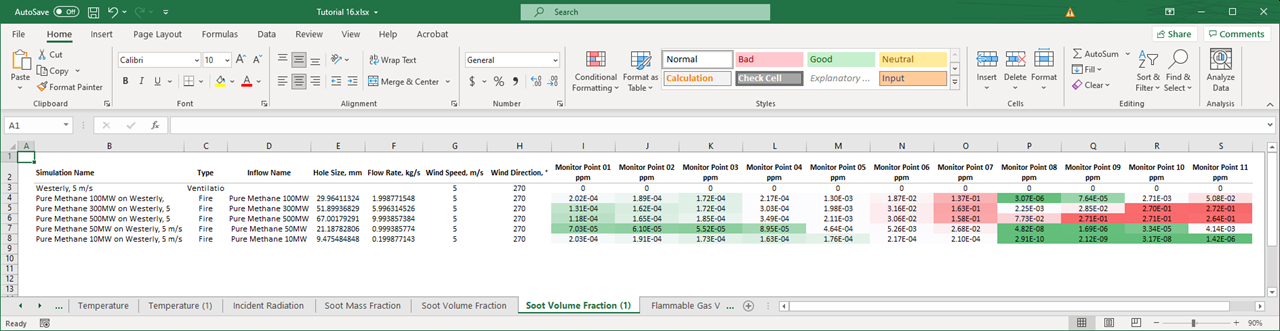
Tutorial 16 - Figure 09 - Excel output with conditional formatting for soot volume fraction levels in ppm at each of the defined monitor points
This concludes Tutorial 16, you should now have an understanding of defining multiple fire cases at the same time and some of the available options of reviewing data in bulk.
Save your project before closing the application.