Visualizations for Transient Fire Simulations
Visualizations for transient fire simulations can be setup and viewed in the same way as with transient dispersion simulations, described in Tutorial 8.
Transient Contours
When defining a contour for a Simulation with transient data, a new dropdown option will appear titled Time Step which will let you select any of the saved time steps to view the result at.
For this example, define a contour at a time step right before shutdown with the following inputs:
-
Simulation to Pure Methane 100MW - ESD@10s on Westerly, 5m/s
-
Time Step to 9.17 (or the value closes to 9)
-
Variable to Temperature, K
-
On Plane to XY Plane
-
Offset to "5.93 meters"
-
Expand the Coloring option and set the Palette to Magma
-
Lower the Opacity slider a little to make the contour transparent
-
Change the Range to User Defined and enter the Min as "200" and Max as "1500"
-
Click Add Item
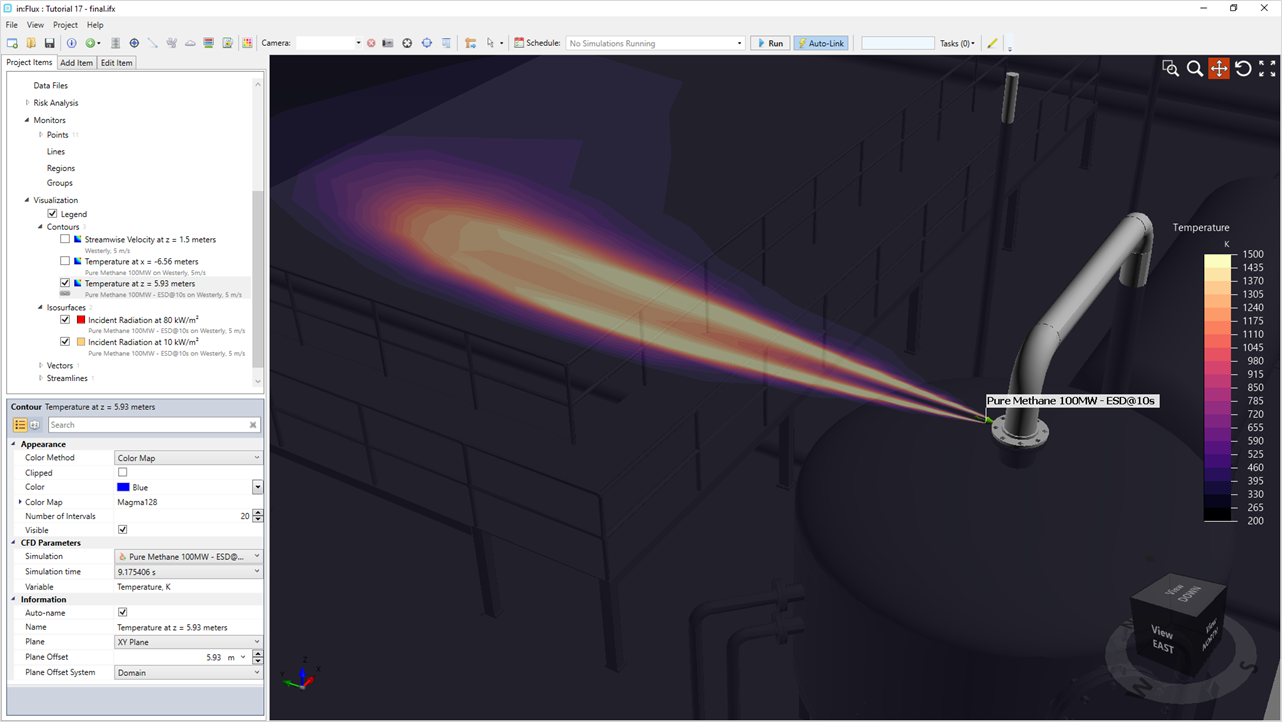
Tutorial 17 - Figure 08 - Contour of Temperature before shutdown occurs
Once defined, the time step associated with the visualization can be changed via its properties panel. Select the newly defined temperature contour from the Project Items Tab and change the Simulation Time parameter (indicated below) to at or near 10.96 seconds and click off the panel to verify the entered information. The updated contour should resemble the figure below showing the temperature reduction just after shutdown. Changing the contour in this way does not change the user defined ranges so the scaling is kept the same as seen in the legend.
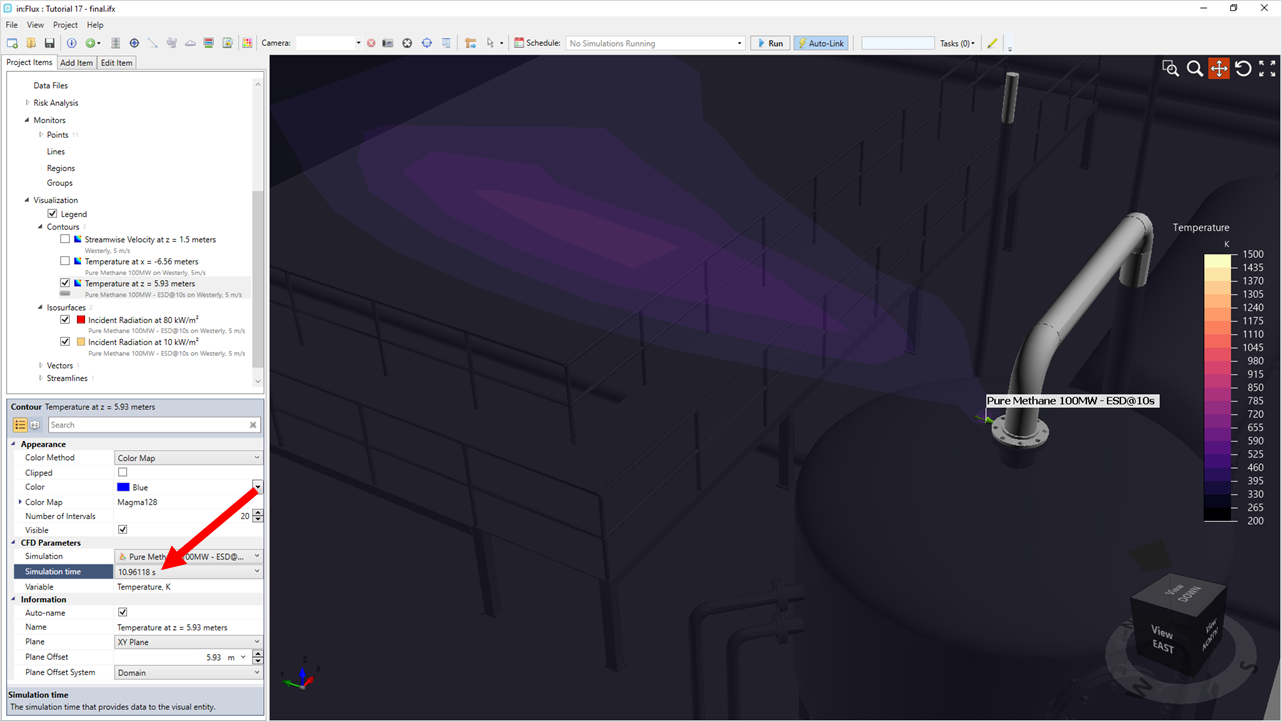
Tutorial 17 - Figure 09 - Contour of Temperature after shutdown occurs
This process can be repeated for any variable and any time step saved for the transient fire cases.
Transient Isosurfaces
Next look at the already defined isosurfaces in the project. Switch both incident radiation isosurfaces to link to the Pure Methane 100MW - ESD@10s on Westerly, 5m/s at 9.17 second by :
-
Right clicking isosurfaces in the Project Items Tab
-
Selecting Set All to Simulation...
-
Select Pure Methane 100MW - ESD@10s
-
Then in the menu that appears select 9.17 seconds or a value near it, before the 10s mark when shutdown occurs. The menu items are shown below of steps 1-4.
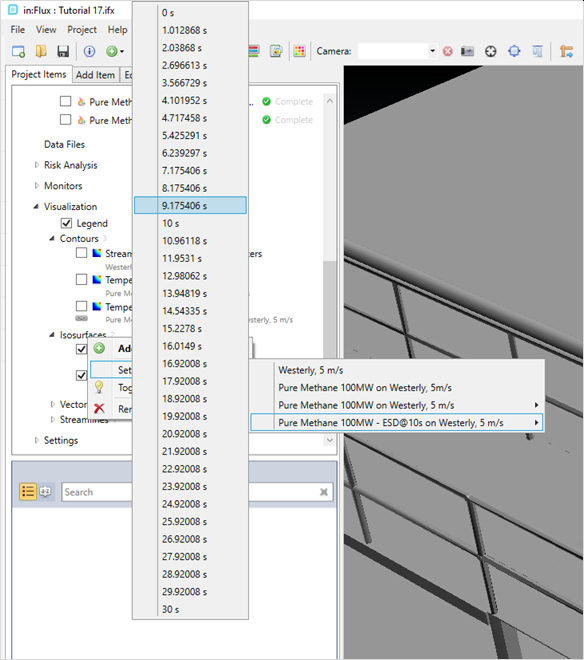
Tutorial 17 - Figure 10 - selection of changing the isosurfaces in the project to another simulation with a time step
-
After some processing your window should appear similar to the below figure.
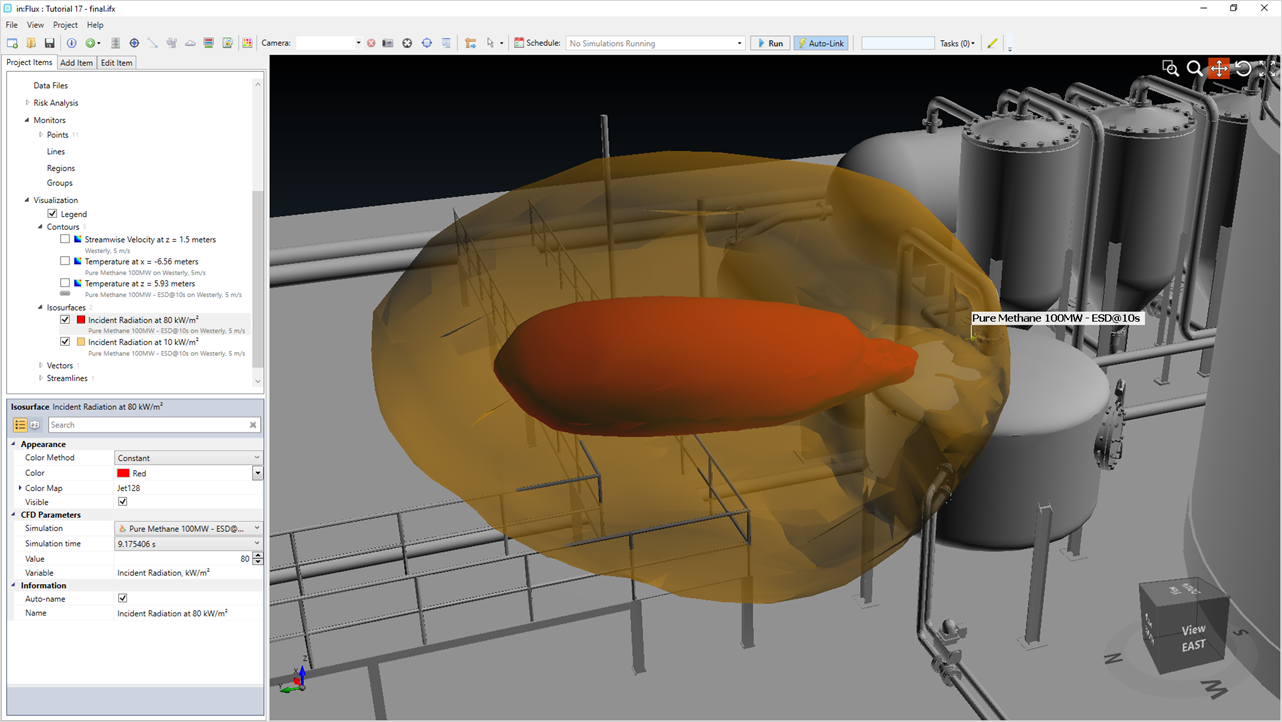
Tutorial 17 - Figure 11 - isosurface of radiation for the fire simulation case at a time of 9 seconds
-
Repeat Steps 1-4 and set the isosurfaces to a time step at 10.9 seconds or after.
-
What does your screen look like? If you get a screen similar to Figure 12 below, with nothing showing, then you have done everything correct. Continue to Step 8 for an explanation why.
Tutorial 17 - Figure 12 - screenshot for incident radiation after 10 seconds
-
Open the Monitor Data Window and change the Variable to Incident Radiation, kW/m2. Double click the cell corresponding to Monitor Point 07 and the shutdown case (this opens the same graph as Figure 06 in the past section). We can see that the radiation value after 10 seconds on the graph drops to almost 0 by 11 seconds. This would explain the apparent disappearance of the isosurfaces at this time step as the radiation values at this time are less than 1 kW/m2. It is important to double check visualization with monitor data so any misinterpretation is understood.
This concludes Tutorial 17, you should now have an understanding of how to setup, run and review transient fire simulations with in:Flux.
Save your project before closing the software.