Tuning the Mean Age-of-Air
As a reminder from Tutorial 4, the mean age of air looks at how “old” particles are if they are released from the upstream boundary of the domain. Once a contour is defined, if you zoom out and look in plan view (as in the below figure), then you will see the mean age of air gradually increase in the direction of the wind. The value at the end of the domain, if it was empty, would roughly be (Domain Length) / (Wind Speed) i.e. how long has it taken the air to flow through the domain.
You can “tune” the contour by adjusting the min and max values to better highlight bad ventilation. Select the contour, then on the property grid, expand the “Color Map” header as described in the User Defined Min/Max section. Uncheck the “Use Variable Min/Max” and then enter your own user-defined min and maxes – in this case, try 0 and 90. This will automatically update the contour and the legend.
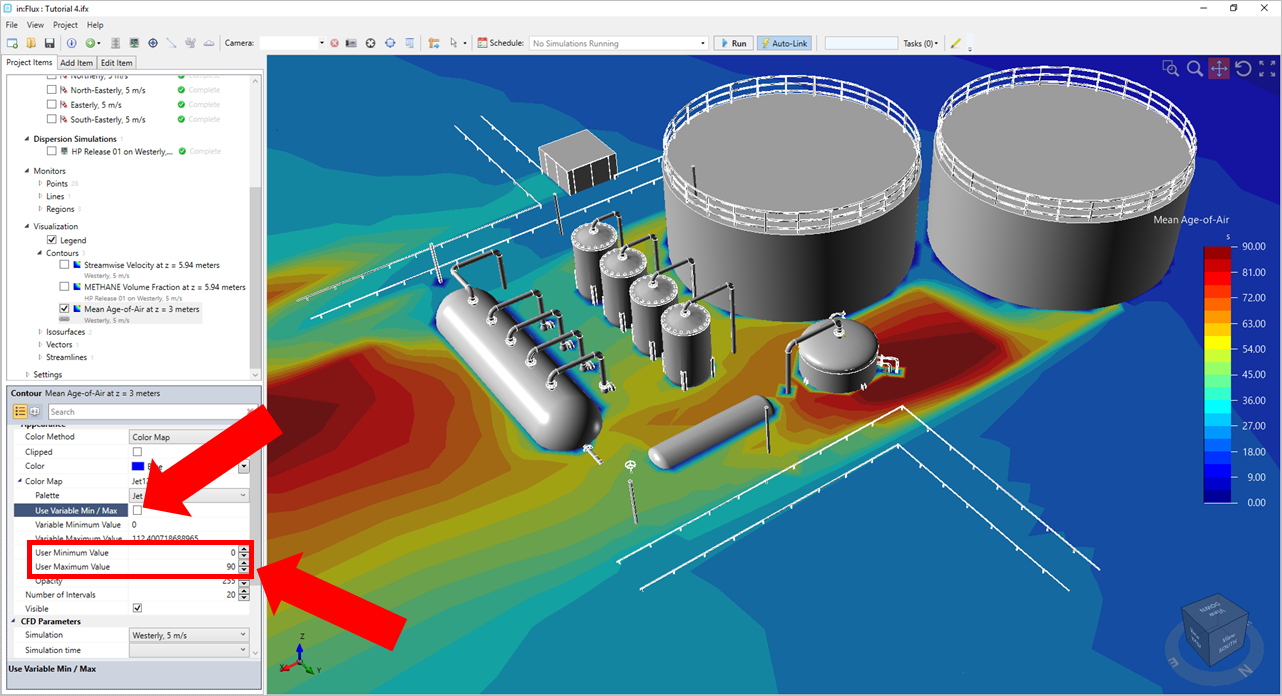
Tutorial 6 - Figure 72 - location for entering user defined minimum and maximum values
From the Color Map header, you can also change to a different color screen other than the default Jet Palette to Magma, shown below. You can learn more about the color maps of in:Flux here.
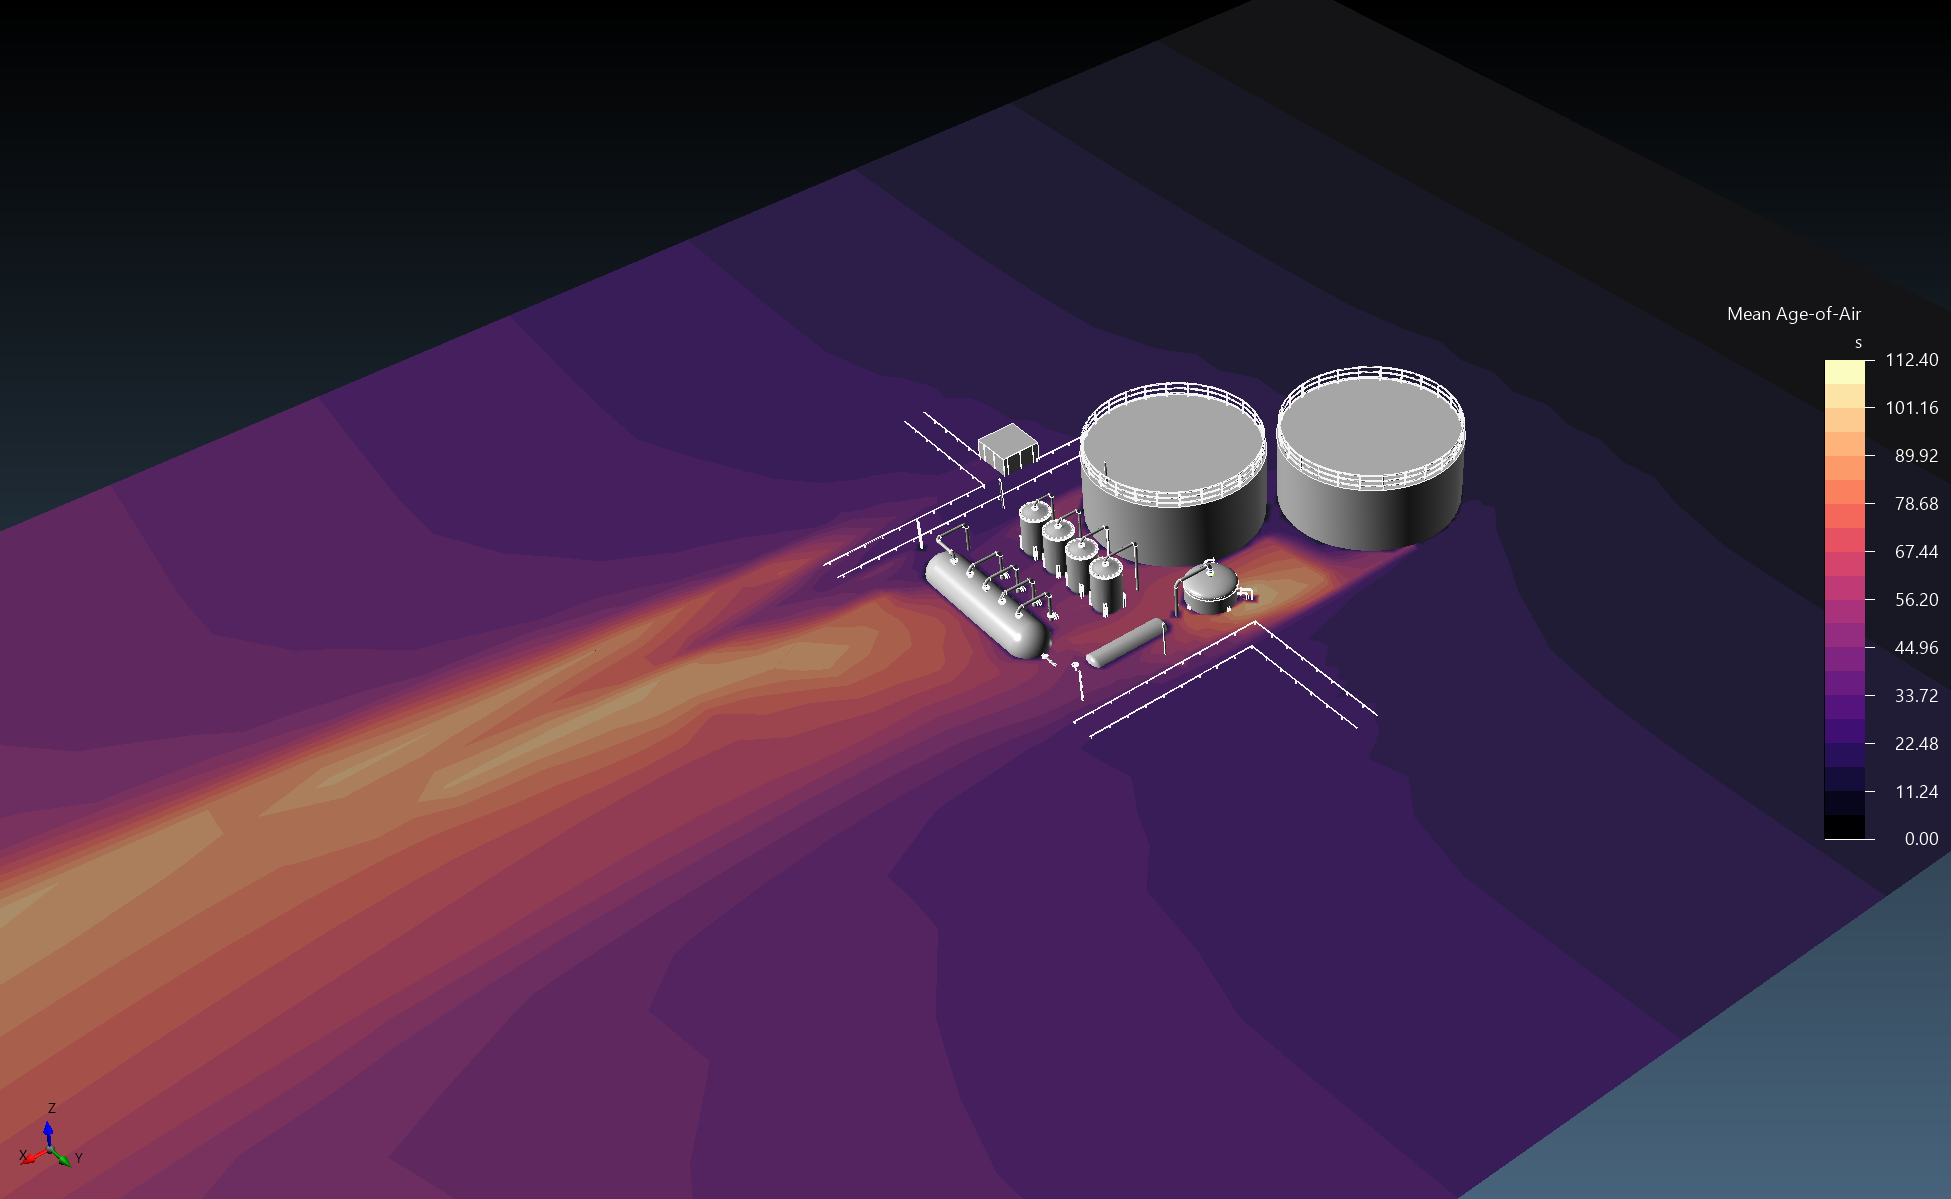
Tutorial 6 - Figure 73 - mean age-of-air contour with magma color map for a westerly wind case on the refinery geometry