Vector Visualizations
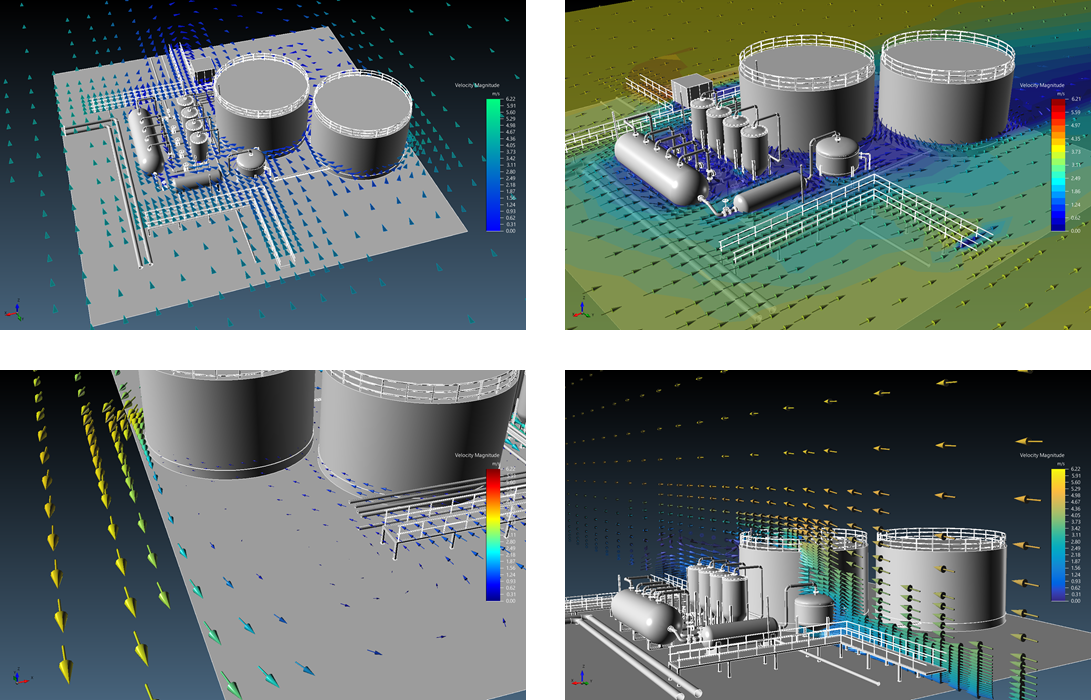
Vector fields show an array of arrows, cones, or triangles indicating direction of flow on a defined plane. Users may choose any of the three Cartesian planes to define a vector field upon. Once defined the color map may be changed to better show velocity magnitude values.
This section will go over the below topics for changing the features of the vector visualization:
Contents of Vector Visualizations: