Reviewing Results
Once the simulations are complete, add two isosurfaces of Methane Volume Fraction , %LFL at values of 100% LFL and 50% LFL for the 3mm leak case. The figure below used a solid blue color for the 100%LFL and a transparent blue for the 50%LFL. Please refer to Tutorial 2 for guidance on how to add isosurfaces.
In Figure 35 below we can see that the isosurfaces are quite small for this case, even though they are pointed into a region with low circulation (500s Mean Age-of-Air contour). The measure tool was used in the below figure to estimate the 50%LFL cloud to be 1.67 meters in length.
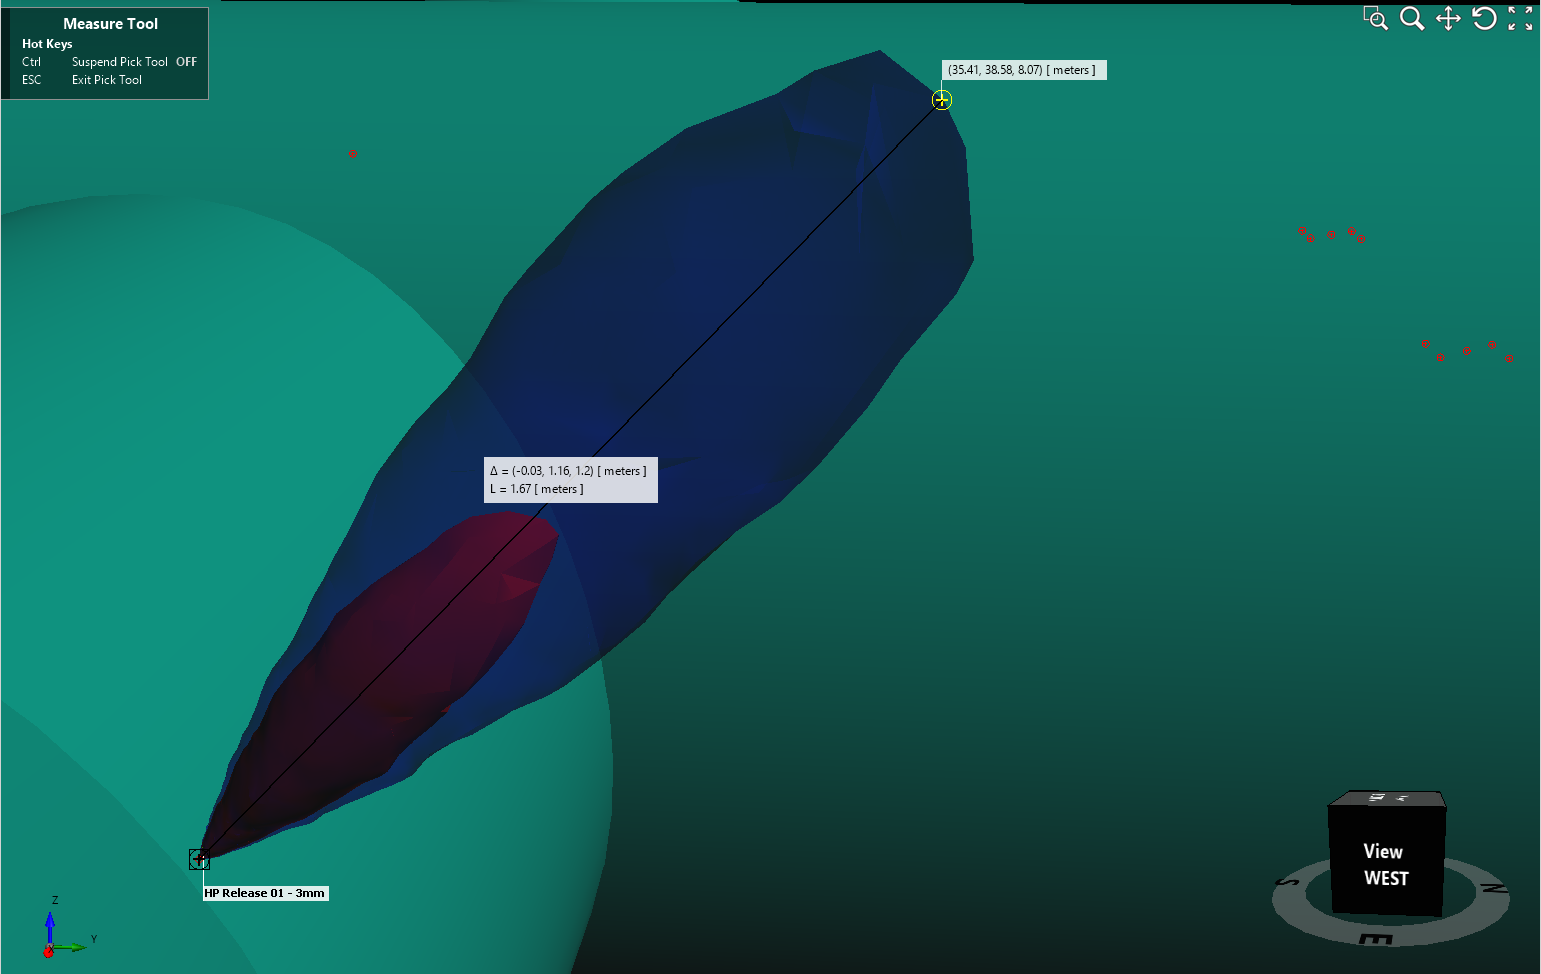
Tutorial 9 - Figure 35 - 100%LFL and 50%LFL isosurfaces for the 3mm methane leak in the internal ventilation simulation
Switch the two defined isosurfaces to be associated with the 6mm leak case. Here we see that even though the gas cloud is larger (with the 50%LFL cloud reaching 3 meters in length) it still is small in comparison to the entire facility volume. Based on these results, it could be determined that more cases need to be simulated with leaks pointing towards other low ventilation regions.
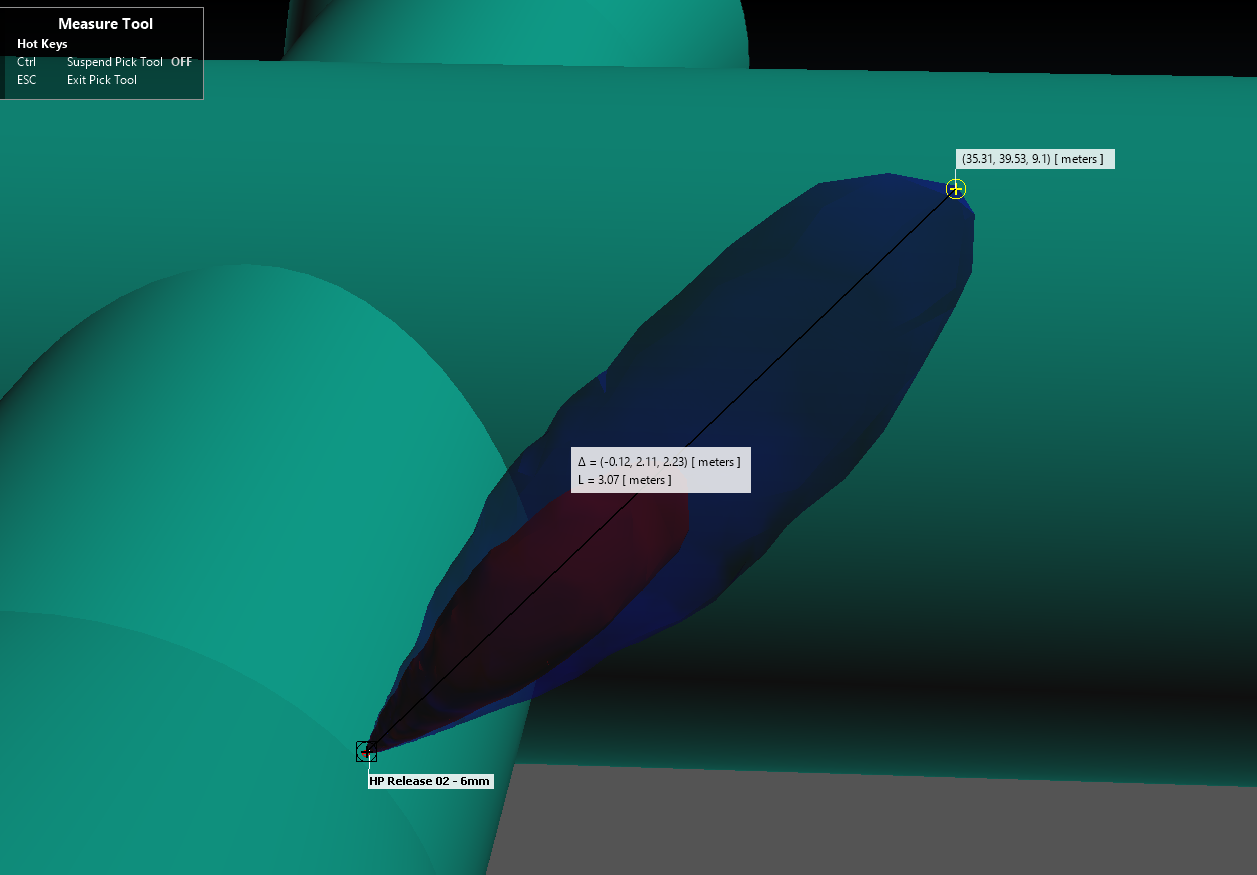
Tutorial 9 - Figure 36 - 100%LFL and 50%LFL isosurfaces for the 6mm methane leak in the internal ventilation simulation
For some simulations the gas cloud size need to be reported. This is true with the PM84 Guidance where the 100%LFL stoichiometric cloud size is needed. For this information, a Monitor Region needs to be defined:
-
From the Add Item tab, select Monitor Region from the Select Item dropdown menu.
-
Set the Name to “Gas Turbine Monitor Region”
-
Ensure that the Building layer of the geometry file is toggled on and use the pick tool
 for Point 1 to select the
red crosshair dot for the upper south-east bounding corner of the building as shown in the figure below, or enter ( 94.5, 10.5, 15). The 'bump outs' of the building will be properly accounted for in the monitor region.
for Point 1 to select the
red crosshair dot for the upper south-east bounding corner of the building as shown in the figure below, or enter ( 94.5, 10.5, 15). The 'bump outs' of the building will be properly accounted for in the monitor region. -
For the second point of the monitor region, select the red crosshair at lower north-western corner or you can enter (12.2, 54.4, 0) in the corresponding coordinate text boxes.
-
Click Add Item
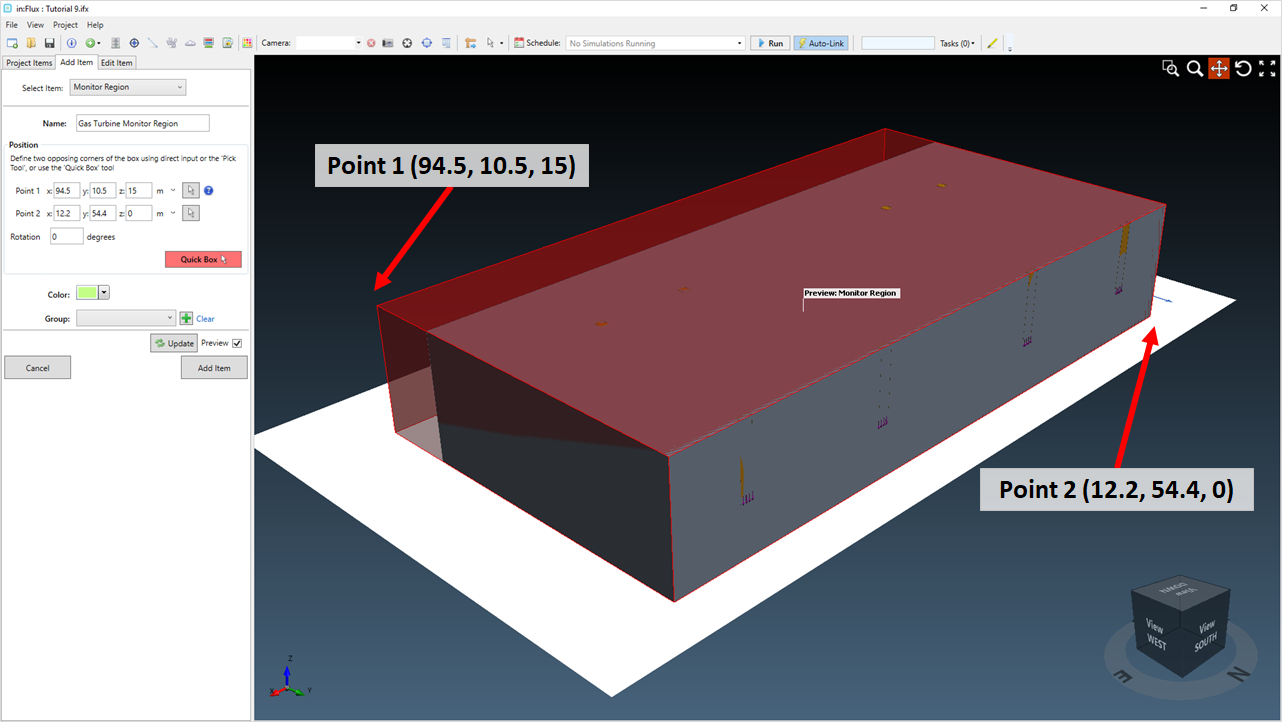
Tutorial 9 - Figure 37 - two definition points for the Gas Turbine Monitor Region
View the Gas Cloud Analysis window ![]() and click the Update button. Once complete
we can see that neither of the simulated cases has an equivalent stoichiometric volume of over 1m3 which is one requirement of the PM84 Guidance.
and click the Update button. Once complete
we can see that neither of the simulated cases has an equivalent stoichiometric volume of over 1m3 which is one requirement of the PM84 Guidance.
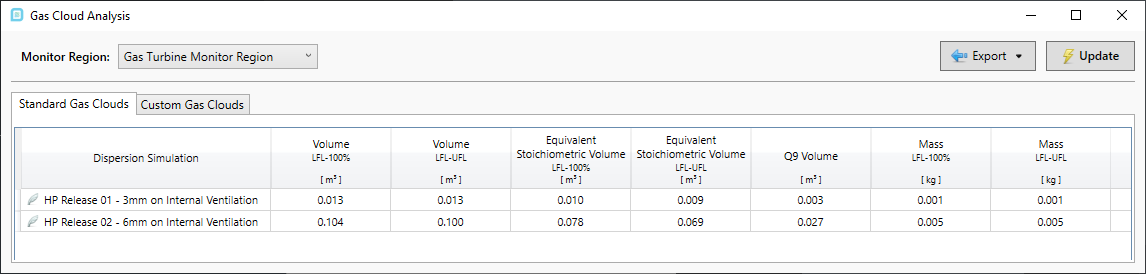
Tutorial 9 - Figure 38 - Gas Cloud Analysis window displaying equivalent stoichiometric volumes for the two simulated cases
A second part is ensuring that the 100% LFL isosurface is not larger than .1% of the facility volume. This can be calculated by looking at the properties panel of the monitor region. Here we see that the open volume is calculated to be 47,955 m3. It can then be determined that by comparing this to Figure 38 above, neither of the two cases simulated results in a gas cloud larger than 47.9m3.
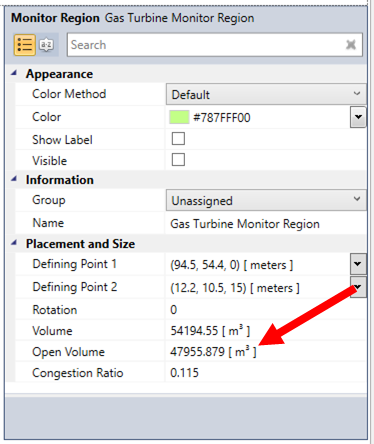
Tutorial 9 - Figure 39 - Properties panel of the defined monitor region showing the congestion ratio as well as the open volume of the facility
You have now completed Tutorial 9 and should understand how to setup and run internal ventilation simulations as well as how to setup and run dispersion cases within internal ventilations.