Exceedance Curves for Surface Heat Flux Data
In the Surface Heat Flux Analysis window, there is an exceedance button. If selected now, no data will be visible in the window that appears. This is because no frequency information has been assigned to the leaks and wind cases in the project.
These exceedance curves are most applicable to risk-based projects where frequency information is commonly entered into the project. For simplicity, we will add leak frequency data to this project rather than use previous risk-based tutorial files. As the latter would require updating several 100 simulations.
Add a leak frequency for each of the five fire inflows:
-
Open the risk manager

-
click the first row representing Pure Methane 100MW leak
-
change the Property field at the bottom of the window to Frequency and enter a value of "1.0e-4" and press confirm
-
You will see the cell representing the Frequency column and the 100MW leak update.
-
Repeat steps 2 and 3 for each of the other 4 simulation cases adding the following hypothetical values:
-
Pure Methane 100MW: Frequency = 1.0e-04
-
Pure Methane 300MW: Frequency = 1.0e-05
-
Pure Methane 500MW: Frequency = 1.0e-06
-
Pure Methane 50MW: Frequency = 2.0e-04
-
Pure Methane 10MW: Frequency = 5.0E-04
-
-
Check that your window is similar to the figure below before closing the risk manager window
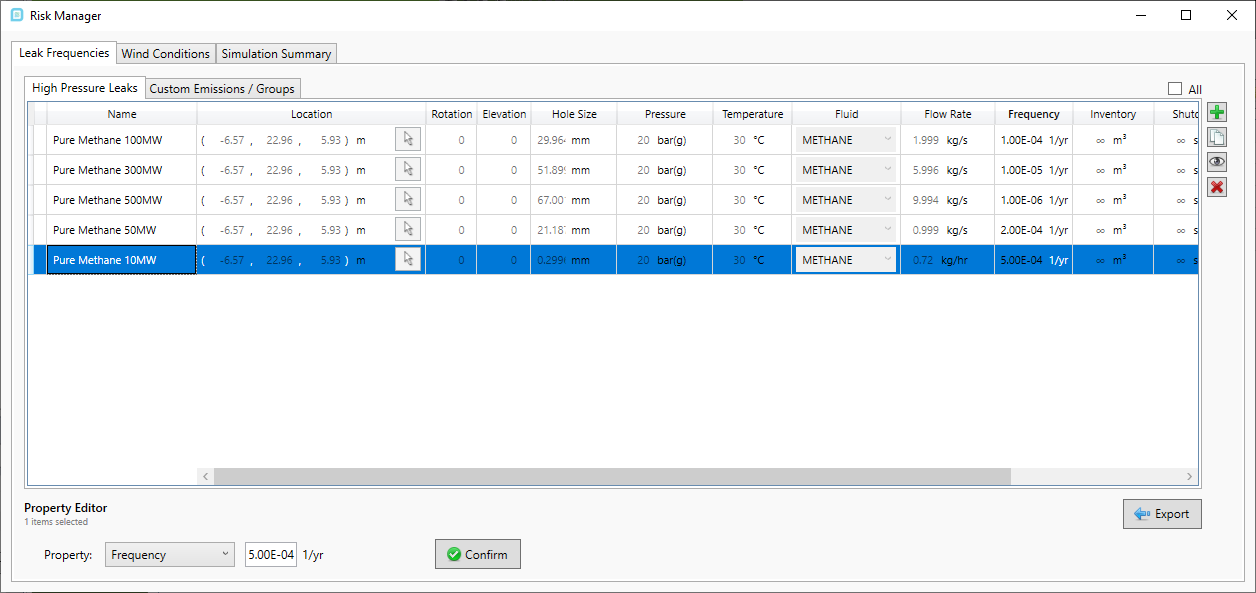
Tutorial 20 - Figure 11 - Adding leak frequency values to the project via the risk-manager
The Westerly, 5m/s wind case will already have a 25% probability value assigned to it. We will leave this as is for this example. Now with the wind probability and leak frequency data added, exceedance curves can be reviewed.
Open the Monitor Exceedance Curves window by clicking the ![]() button on the toolbar or choosing the same from the Project Menu.
button on the toolbar or choosing the same from the Project Menu.
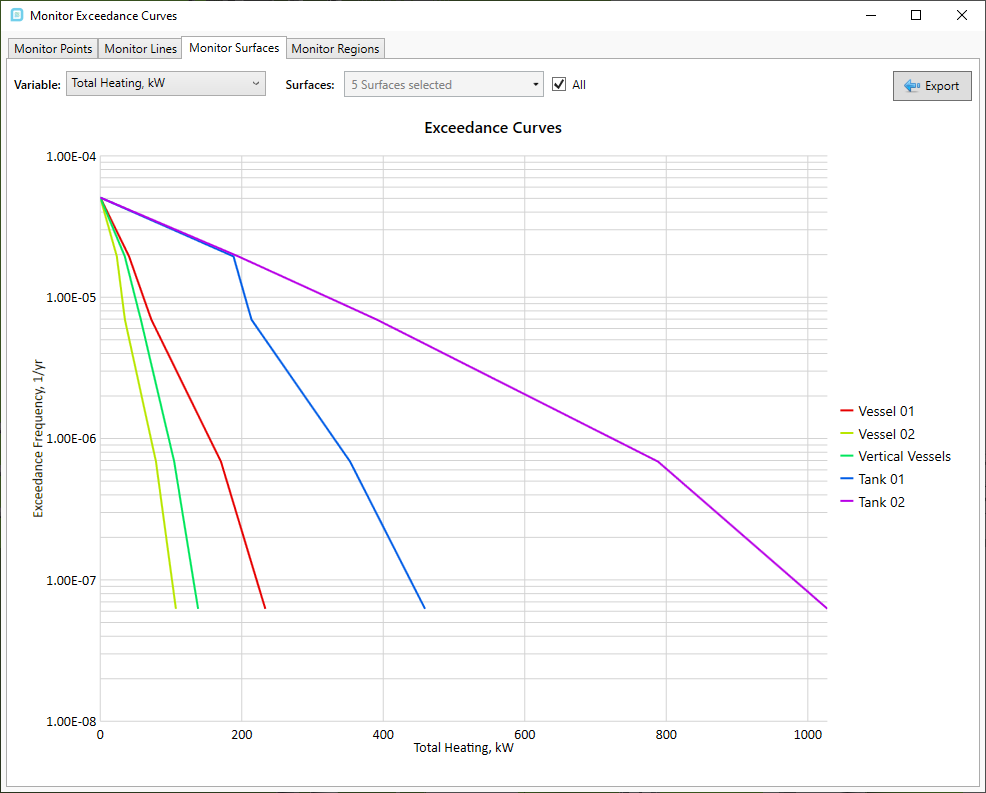
Tutorial 20 - Figure 12 - Exceedance curves for the defined Monitor Surfaces and assigned leak frequencies
Exceedance curve information is available for any monitor in the project. For this tutorial Monitor Surfaces were added but as the file has monitor points defined previously, this data is also available by clicking the Monitor Points tab at the top of the window.
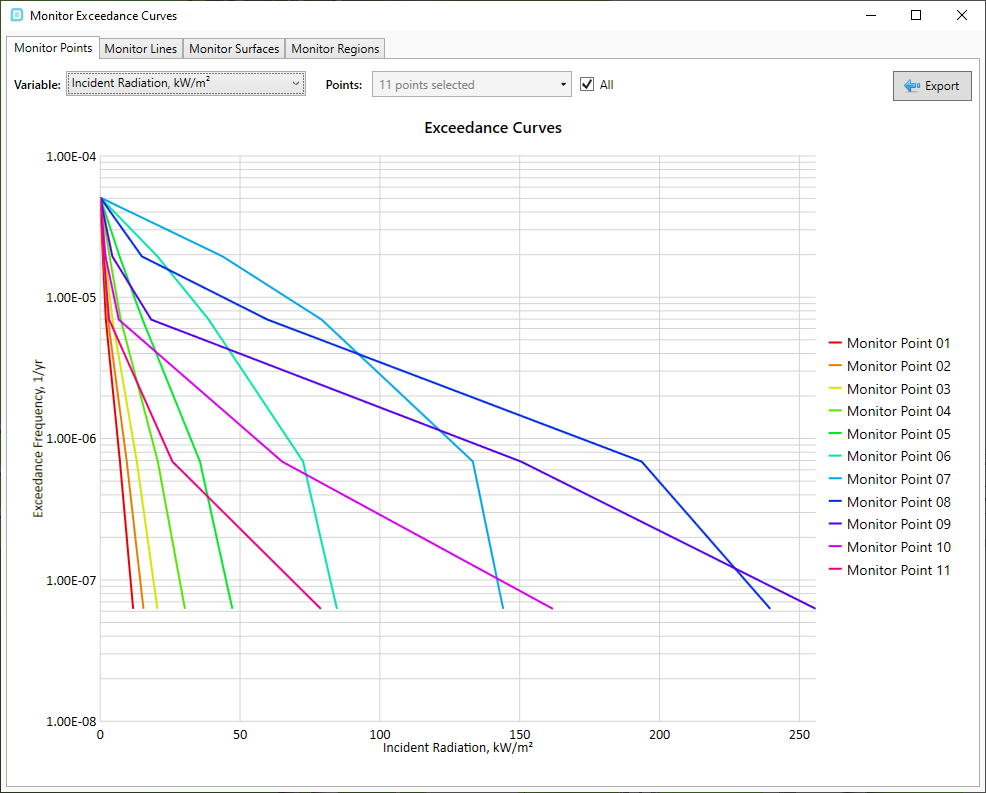
Tutorial 20 - Figure 13 - Exceedance curve for monitor points in the project
These exceedance curves can be generated for any variable associated with the chosen monitor. Have a look at this section of the risk-based gas mapping tutorial for viewing exceedance contours on gas cloud sizes.
You have now completed Tutorial 20 and should have an understanding of how to define monitor surfaces in your project and review the surface heat flux data for each.
Save your project file before closing.