Exceedance Curves
An exceedance curve can be viewed for any up-to-date monitor in your in:Flux project.
Click on the Monitor Exceedance Curves button (![]() ) on the tool bar, or select the same in the Project Menu to open the chart. Alternatively, you
may click the button
) on the tool bar, or select the same in the Project Menu to open the chart. Alternatively, you
may click the button ![]() on any monitor window (monitor point data, monitor line data, monitor region data, ventilation analysis data, gas cloud analysis data, or heat flux
data). For exceedance curves with dispersion or fire simulations, leak frequency data must be entered prior to viewing the chart.
on any monitor window (monitor point data, monitor line data, monitor region data, ventilation analysis data, gas cloud analysis data, or heat flux
data). For exceedance curves with dispersion or fire simulations, leak frequency data must be entered prior to viewing the chart.
You may plot any variable that is available for the associated monitor, e.g. stoichiometic gas cloud volumes for monitor regions or H2S, ppm concentration for monitor points.
Some examples of various exceedance curves that can be generated are provided below:
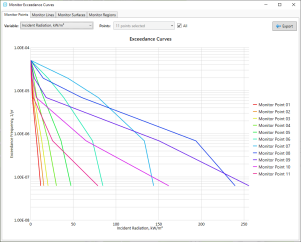
Exceedance curve for frequency of incident radiation values for a series of monitor points along a walkway from Tutorial 20.
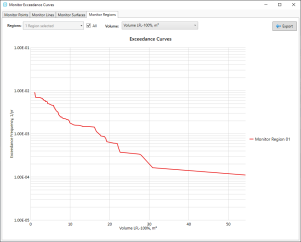
Exceedance curve for a risk-based gas mapping project showing frequency of gas cloud sizes, discussed more in this section
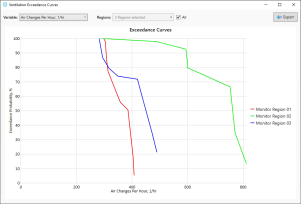
Exceedance probability of air changes per hour for various monitor regions, exceedance curves for ventilation can be accessed via the Ventilation Analysis window:
The Exceedance curve and associated data can be exported to excel for further analysis by clicking the Export button in the upper right corner.