Surface Heat Flux Data
Updating Monitor Surface Data
If the monitor surface name has a gray font then the data will need to be updated. This can be done by right-clicking on each monitor surface name and choosing regenerate, shown below, or can be done all at once from the Surface Heat Flux Analysis Window.
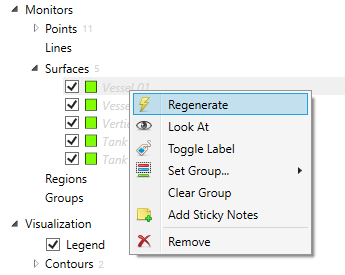
Tutorial 20 - Figure 05 - Regenerating individual monitor surface data which will update all out-of-date surfaces
in:Flux will extract the needed information from memory for each fire simulation, as shown below. As this example only has five simulations it will not take long to update, however for large projects (>50 cases) using data files and the updating project data with ifx:Solve function can be beneficial.
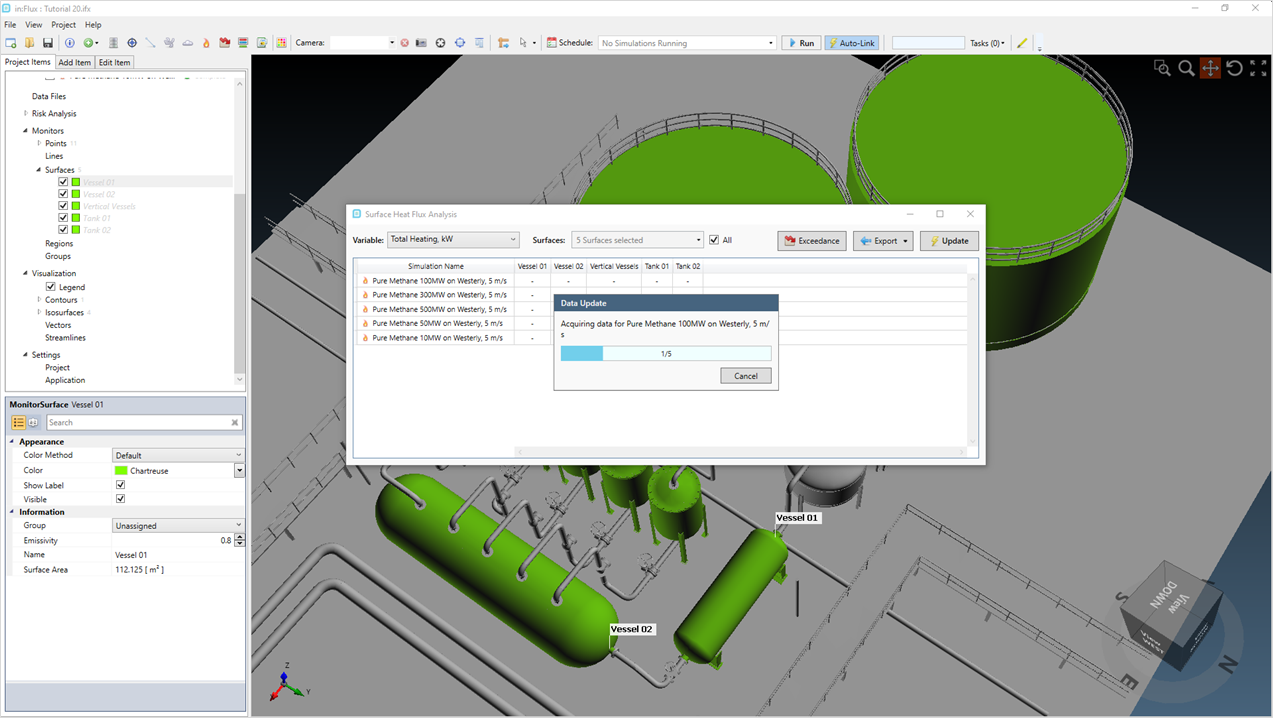
Tutorial 20 - Figure 06 - Updating monitor surface data for the five surfaces in the project
Reviewing Surface Heat Flux Data
Once the monitors have been updated, click the Surface Heat Flux Analysis button (![]() ) on the toolbar or select the same from the Project Menu. Seven Variables will
be available to review:
) on the toolbar or select the same from the Project Menu. Seven Variables will
be available to review:
-
Total Heating, kW - combines the radiative and convective heating values
-
Radiative Heating, kW - heating from the thermal radiation produced by the fire case
-
Convective Heating, kW - heating from the increased air temperature from the fire case
-
Average Heat Flux, kW/m2 - divides the total heating by the surface area of the defined monitor surface
-
Maximum Heat Flux, kW/m2 - maximum heat flux obtained on the monitor surface
-
Maximum Temperature, K - maximum temperature obtained on the monitor surface
-
Maximum Temperature, °C
The above variables should be used when assessing structural or surface radiation. For analyzing human impacts of firet the Incident Radiation variable should be used. Both the incident radiation and the variables above can have solar radiation added to the radiation calculation.
The window can include all monitor surfaces in the project or using the Surfaces dropdown menu a select number can be displayed - just as with monitor points. Below shows the total heating for each of the five fire simulations, recall that for the Vertical Vessels this includes 4 equipment items.
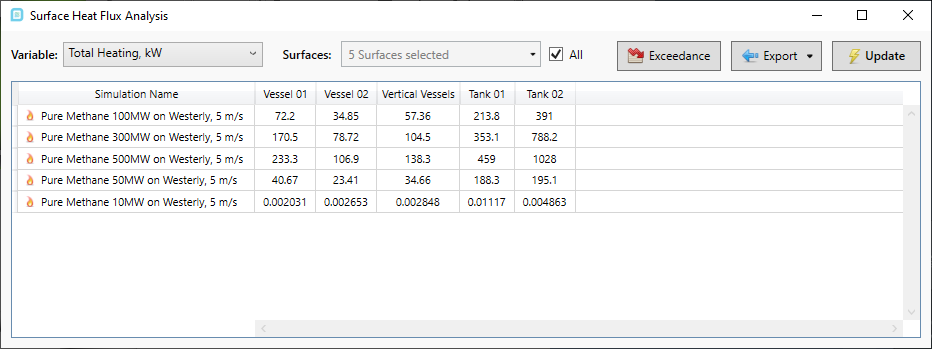
Tutorial 20 - Figure 07 - Surface Heat Flux Analysis
Note how the Tank 02 monitor surface has higher values than Tank 01 even though it is further away from the leak source. Although it may be counter-intuitive, let's add an isosurface to verify this data.
From the Add Items Tab:
-
Add and isosurface for the Pure Methane 300MW on Westerly, 5m/s Simulation
-
Set the Variable to Incident Radiation, kW/m2 and the Value to "7 kW/m2"
-
Change the color to a transparent blue and click the Add Item button.
Rotate the model to see between the leak location and Tank 01. Here we see that the equipment under the leak location is shielding some radiation from getting to Tank 01. This then provides reasoning and justification for the larger surface heat fluxes on Tank 02 seen in Figure 07 above.
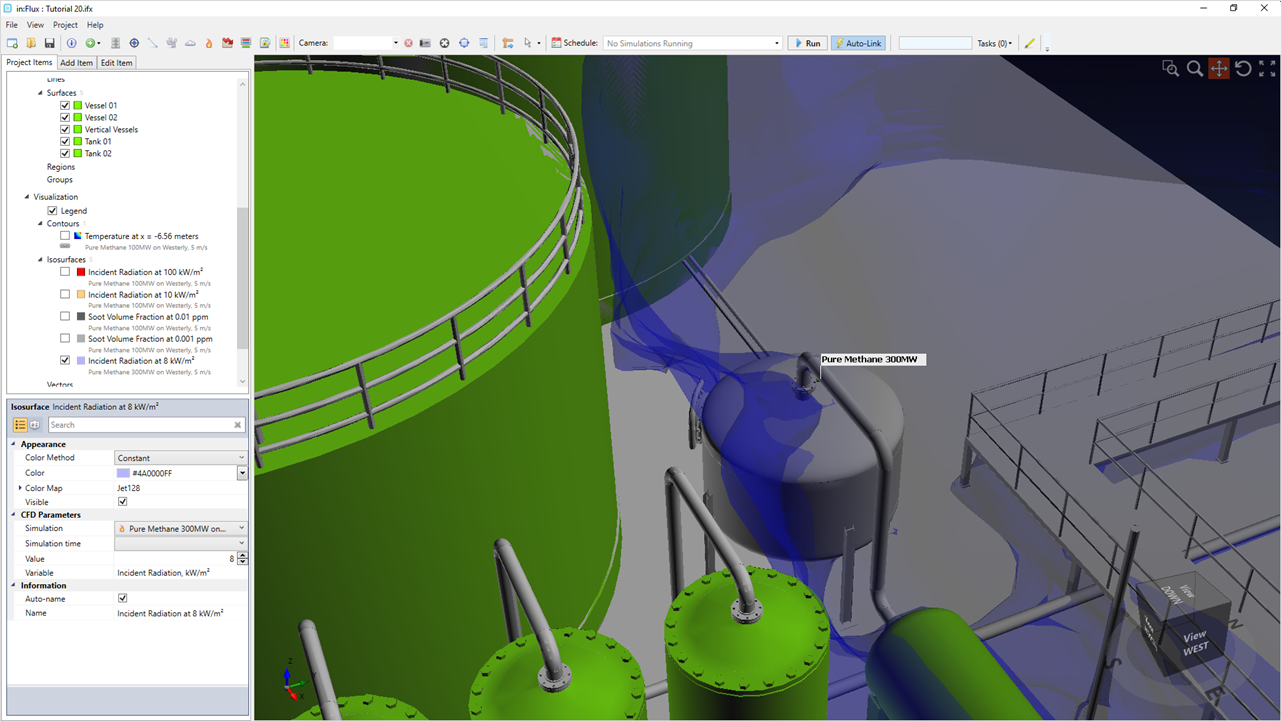
Tutorial 20 - Figure 08 - Viewing a 8kW/m2 incident radiation isosurface to view the shielding that an equipment item is providing towards Tank 01
Transient Monitor Surface Data
Although the Tutorial 16 fire simulations are steady state, monitor data can also be viewed for transient simulations. Below shows the same five monitor surfaces added to the transient Tutorial 17 ifx file. As with transient data for monitor points, lines and regions - double clicking a cell with transient data will open a graph showing the surface heat flux data with respect to time. The graph below is showing the total Heating for the Tank 01 Monitor Surface for the transient fire case with a shutdown at 10s.
![]()
Tutorial 20 - Figure 09 - Example of transient results for monitor surfaces
Exporting Monitor Surface Data
With the Surface Heat Flux Analysis Window still open, click the Export button ![]() and choose All Variables. You will then be able to save an
excel file to a chosen directory. Open the Excel file to view each of the variables with more significant digits and tabs for each of the variables associated with heating. Information about each fire simulation such as hole size, flow rate, total
power, etc is also provided.
and choose All Variables. You will then be able to save an
excel file to a chosen directory. Open the Excel file to view each of the variables with more significant digits and tabs for each of the variables associated with heating. Information about each fire simulation such as hole size, flow rate, total
power, etc is also provided.
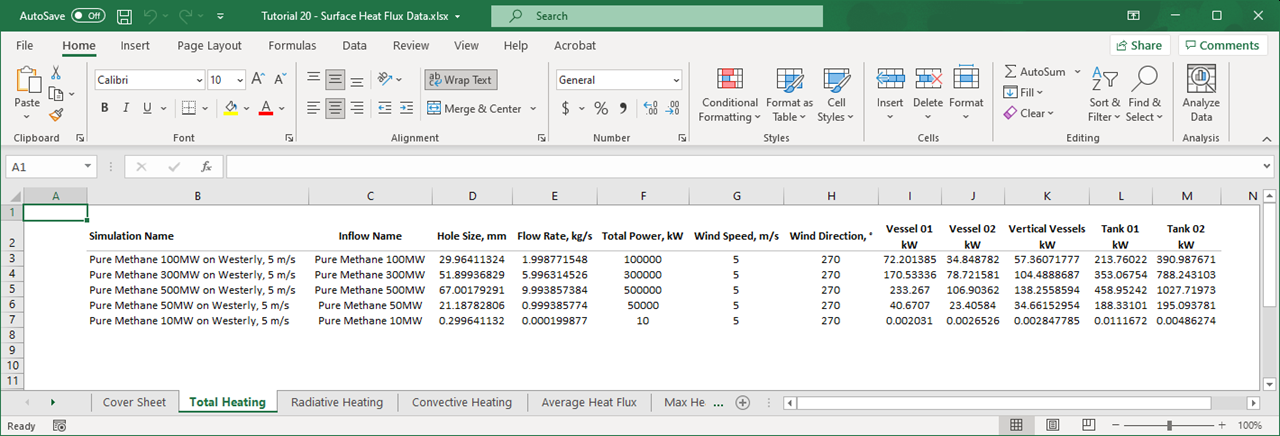
Tutorial 20 - Figure 10 - Excel export of Surface Heat Flux Data
Continue to the next section to review exceedance curves for the defined monitor surfaces.