Wind Chill Temperature Variable
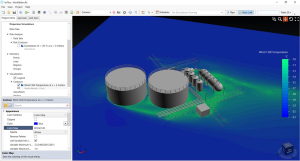
After ventilation simulations have finished calculating the wind chill temperature can be plotted using the Wind Chill Temperature variable for contours and vector fields. Color Maps and other contour visualization properties can be edited and changed in the same way as other visualizations.
This variable can be chosen when defining new Risk Data Sets to view exceedance greater than or lower than a specified temperature. Probability data for each of the wind directions and wind speeds should be entered via the Risk Manager to view exceedance contours.
The variable is calculated from ISO 11079:2007 (see Annex D here). Although this is an empirical equation and doesn't explicitly show

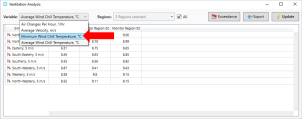
The minimum and average wind chill temperature is also reported in the Ventilation Analysis window (under the Project Menu) for defined monitor regions.

Exceedance curves can also be produced for this variable for each monitor region in the project.