Tutorial 3 - Monitor Points, Lines and Regions

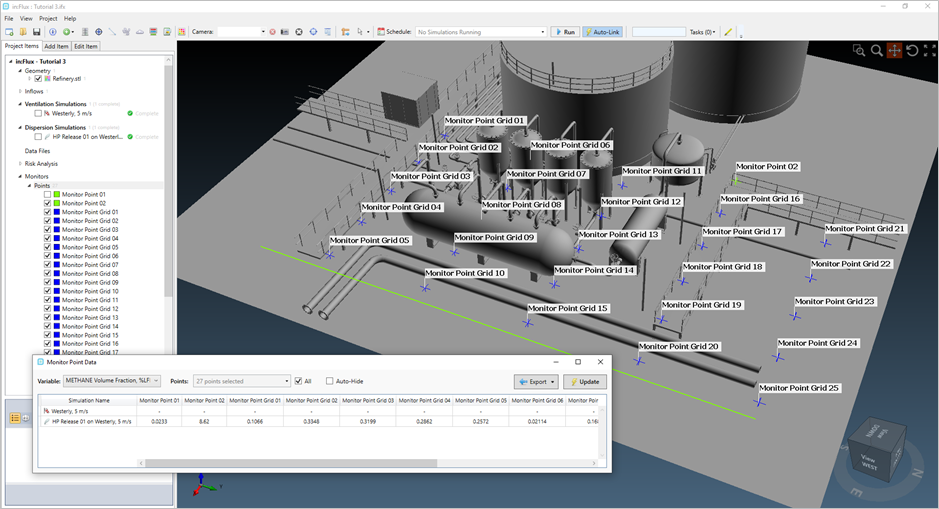
Monitor points in in:Flux are specified data points in the project which provide information about the simulation, e.g. wind velocity values, gas concentrations, temperatures, etc. These points can be placed before a simulation has been set, while it is calculating, or after it has completed. There is no limit to the number of monitor points that can be added to an in:Flux project. The monitor point data can, once defined, can be exported to an excel document for further analysis. Similarly, monitor lines provide variable data across a defined line which can be the average, minimum, maximum or integrated values.
Monitor regions are cuboid volumes where you want to receive gas cloud information, e.g. LFL gas cloud volume, equivalent stoichiometric volume data, and the mass of the LFL gas cloud. They can also be used to obtain custom cloud data for other non-combustible variables. These regions are usually placed so that they surround the process area of the facility.
Monitor surfaces are applicable to projects with fire simulations and are discussed in Tutorial 20.
In this tutorial you will learn how to:
-
Define a single monitor point
-
Define a grid of monitor points
-
Define a monitor line
-
Define a monitor region
-
View monitor data and export to excel
-
View ventilation analysis data
Files used in this tutorial, or you may continue for your own working file from Tutorial 2:
-
Tutorial 2.ifx (9MB) - included in the inFlux v2.0 Tutorials 01 - 09.zip (84MB)
Contents of Tutorial 3:
Last updated August 15, 2024 with in:Flux v3.21